Since the first energy use report in November 2021, the Solana Foundation has pledged to regularly measure and publish the carbon footprint of the network and make the network carbon neutral via offsets.
Today, the Solana Foundation is pleased to announce that for the first time, the Solana Foundation has offset the 100% network’s carbon footprint by purchasing carbon offsets entirely onchain. Additionally, as of March 2023, the network’s carbon footprint is tracked in real time at SolanaClimate.com.
Key takeaways of the December 2023 energy use report:
- The Solana blockchain’s carbon footprint totalled 4,392.9 tCO2 over the six month period from April 1, 2023 - Sept. 30, 2023, annualized to 8,785.8 tCO2.
- Solana energy use per transaction has declined by 25% since the last energy use update and total emissions decreased by 17.5%.
- In keeping with its commitment to keep the Solana network carbon neutral, the Solana Foundation purchased 10,901.2 tons of carbon credits to offset the network’s 2022 carbon footprint. For the first time ever, these credits were purchased entirely on chain and were made via ecoToken and Sunrise Stake.
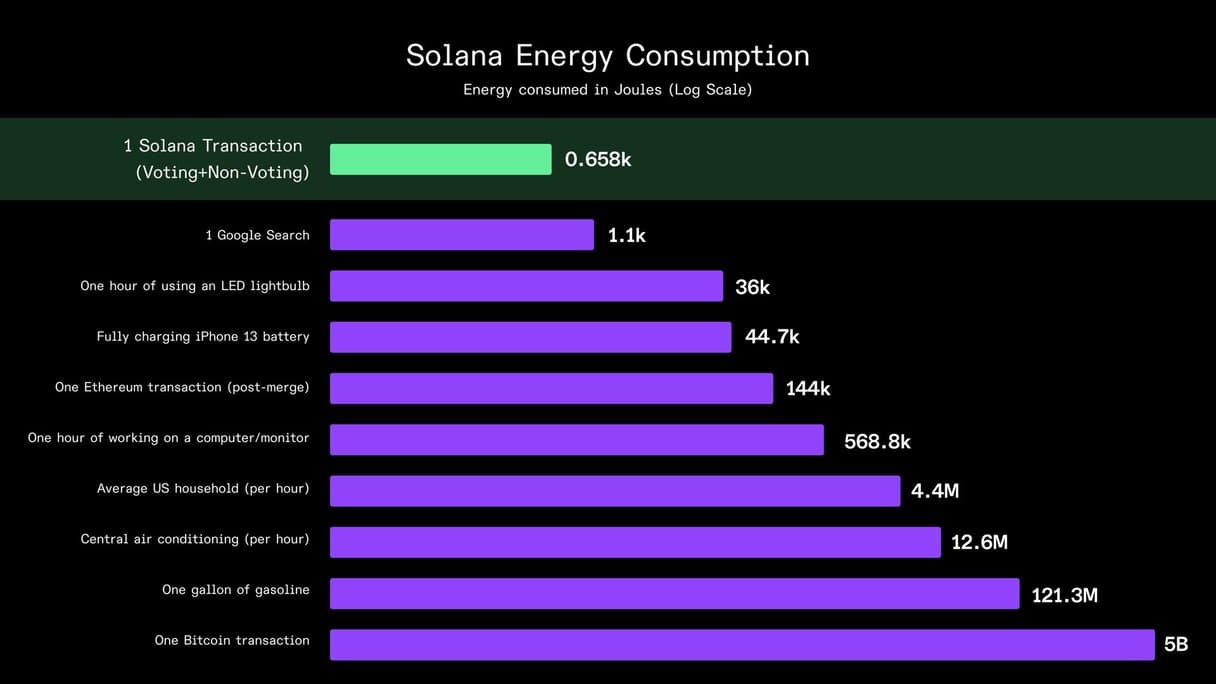
Since the last update on energy use and emissions from the Solana Foundation (the period between April 1, 2023-Sept. 30, 2023), the Solana blockchain generated 4,392.9 tons of Total Average Carbon Emission (tCO2e), an average of 732.2 tCO2 per month. The update before this covered a year-long period (April 1 2022-March 31, 2023) that included 10,651.2 tCO2e, for an average of 887.6 tCO2 per month. This indicates a decrease in carbon emissions per month in the period since the March 2023 energy use report. This decrease in emissions is due to a decrease in energy use per transaction of 25%, from 0.879k J to 0.658k J.
The Solana Foundation purchased offsets for 100% of carbon emissions from the Solana blockchain for the 2022 calendar year, a total of 10,901.2 tons of carbon as calculated through real-time monitoring from TryCarbonara, via embedded software directly on nodes within the Solana blockchain. The Solana Foundation also commits to offsetting the network’s 2023 carbon footprint once the year is complete, in keeping with the Foundation’s commitment to keep Solana carbon neutral.
This purchase of carbon offset credits was from two organizations:
- 5,000 tons of carbon offset credits from ecoToken verified by Regen Network, and 5,902 tons of carbon offset credits from Sunrise Stake, enabled by Toucan Protocol.
- The ecoToken purchase is split between different types of credits and projects: City Forest credits in the United States, and REDD+ credits in Colombia, at the Mataven Forest Unified Indigenous Reserve Project. ecoToken carbon offset credits are independently verified by third-parties, and involve both preservation of existing forests, and planting of new trees or reforesting depleted areas.
- The Sunrise Stake purchase was completed onchain through a dedicated "Offset Bridge" built by Sunrise Stake to buy and retire Toucan NCT, a nature-based carbon token. The offset bridge allows USDC on Solana to be bridged to chains supported by Toucan, and allows the retirement certificates to be bridged back to Solana in the form of a Retirement NFT, that contains details of the total carbon retired. For this purchase, verified REDD credits go towards funding the Rimba Raya Biodiversity Reserve Project, which preserves tropical peat swamp forest in Indonesia.
The carbon emissions tracker at SolanaClimate.com was developed in collaboration with TryCarbonara, a carbon data platform, and embeds software directly on Solana nodes to provide the most comprehensive and accurate measurement of the blockchain’s footprint to date.
Below is an estimate of the network’s carbon emissions in the past 6 months since the previous blog post on the network’s emissions (April 1, 2023-Sept. 30, 2023):
Updated Solana network energy use numbers, December 2023
| Stat | Value | Description |
| Energy per tx | 0.658k J | Energy use per transaction (voting + non-voting transactions) |
| Carbon footprint (6m avg) | 4,392.9 tCO2e | Total carbon footprint (average emissions, 6 month period) |
| Carbon footprint (annualized) | 8,785.8 tCO2e | Total carbon footprint (average emissions, annualized) |
| Total nodes | 4,451 | Total number of nodes (validators and RPC nodes) [1] |
| Total energy (MWh) | 10,830.50 MWh | Total energy consumption, MWh |
To put this annualized number in perspective, it’s a similar amount of carbon generated from powering 5,685 American homes for a year. It’s also a fraction of the carbon emissions generated by major international companies — for example, 2% of the carbon emissions generated by Spotify. [2]
This measurement dynamically changes based on the throughput of individual validators, when they’re online and offline and changes in the validator network over time.This data includes:
- Emissions measurement of RPC nodes via instrumentation of the underlying hardware
- Emissions granularity at the server level incorporating geolocation of validator and RPC nodes
- Marginal (or consequential) emissions based on the incremental emissions impact of new demand as it relates to the overall distribution of grid supply. This framework can be useful when gauging the environmental impact of changes and optimizations to energy consumption and accounts for the renewable energy mix of different sources of electricity.
- Embodied emissions based on the manufacturing, transportation, and end-of-life management of the hardware infrastructure of the Solana Network.
- Power Usage Effectiveness (PUE), which describes the overall efficiency of a data center.

Source: https://solanaclimate.com/
The data set is detail-rich, open, and free to use, making it possible to scrutinize the sources of network emissions down to the validator level. For more info on this dataset and possible uses and points of comparison, check our original announcement of real time carbon emissions.
We hope the Solana Foundation's efforts will inspire other blockchain networks and projects to take similar steps towards measuring their emissions and building a more regenerative onchain community. If you’re interested in engaging or learning about these efforts, email climate@solana.org.
Footnotes
1. TryCarbonara measures total node count by including all nodes that have been active over a period of time, including RPC and block-producing nodes. It is not a snapshot of the current number of live nodes. If a node has been active for one month over the past 6, it will still be included as part of the carbon footprint calculation. TryCarbonara uses this approach in order to be as granular and holistic as possible in node count.
2. Source: Spotify (as of 11-15-2023)
