
TL;DR
- Current resource requests are poorly calibrated: consumed Cost Units are only ~20% of requested on aggregate; even transactions explicitly setting both limits overrequest by ~95k CU on average (p90 ~280k)
- The fee impact is broad and highly workload-dependent: even assuming perfect resource pricing, only ~28% of transactions see a fee increase below 10%. Transfers are roughly unaffected/slightly cheaper, while account creation, CLOB market making and especially on-chain routing become more expensive
- Trading infrastructure is most exposed: average fee increase is ~0.000068 SOL for Jupiter, ~0.00010 for Titan and ~0.00012 for DFlow; higher costs also raise the minimum profitable alpha for atomic arbitrage
- Validator economics change only moderately: optimized vote transactions become ~12.3% cheaper, while leader protocol-fee revenue is unchanged for single-signer transactions and falls for multisig traffic; estimated average loss is ~0.00015 SOL/block
- The largest macro effect is higher SOL burn: estimates range from ~6–8k SOL/epoch under 10% resource optimization, ~8–10k with current consumption and perfect requests, to ~30–35k under the p75 residual-mispricing scenario. These remain behavioral counterfactuals, not forecasts.
Relevant Charts
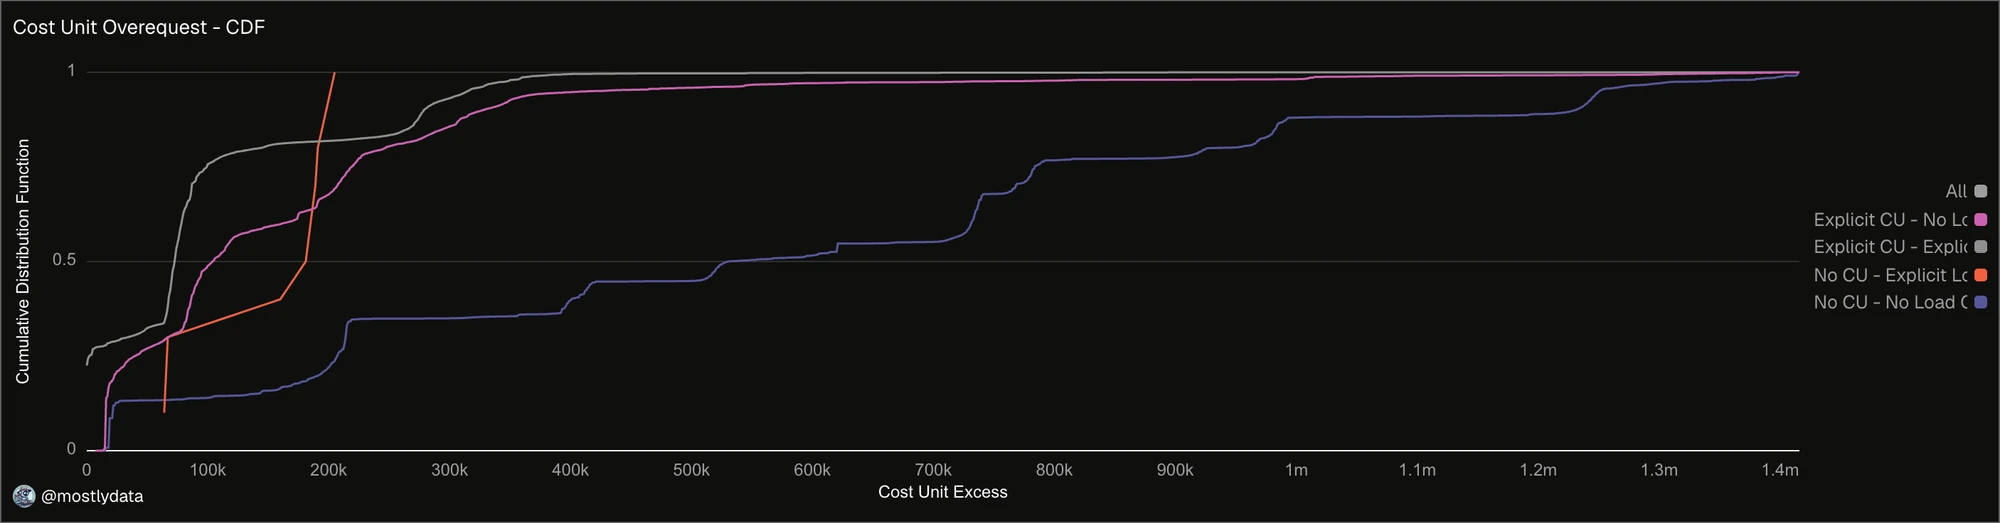
Distribution of Cost Unit excess per transaction. Here we display the CDF of Cost Unit excess (requested minus consumed) per transaction grouping txs that explicit CU and load data size (grey line), explicit CU but no load data size (pink line), explicit load data but no CU (orange line), use default for both (blue line). The value on y-axis represents the probability to find a tx with a Cost Unit excess lower than the value on the x-axis. Figure shows how txs with no explicit CU and load data size are the one with the highest excess of Cost Unit.
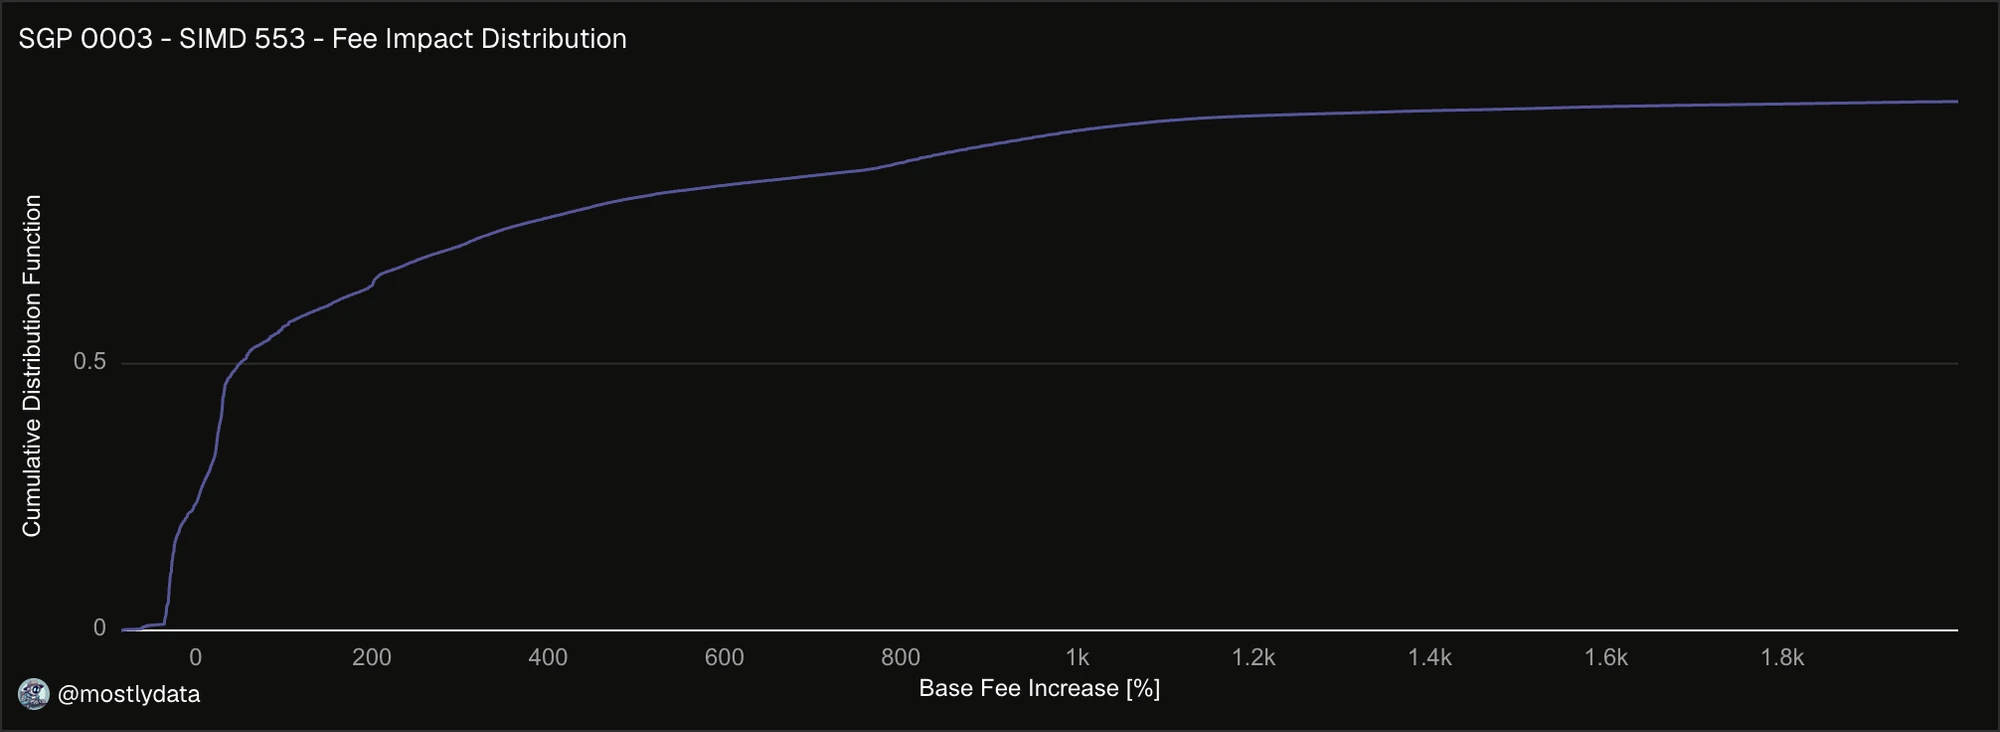
Distribution of the base fee increase with SGP-0003. Here we display the CDF of base fee increase expressed as percentage. The value on y-axis represents the probability to find a tx with a percent increase on base fee lower than the value on the x-axis.
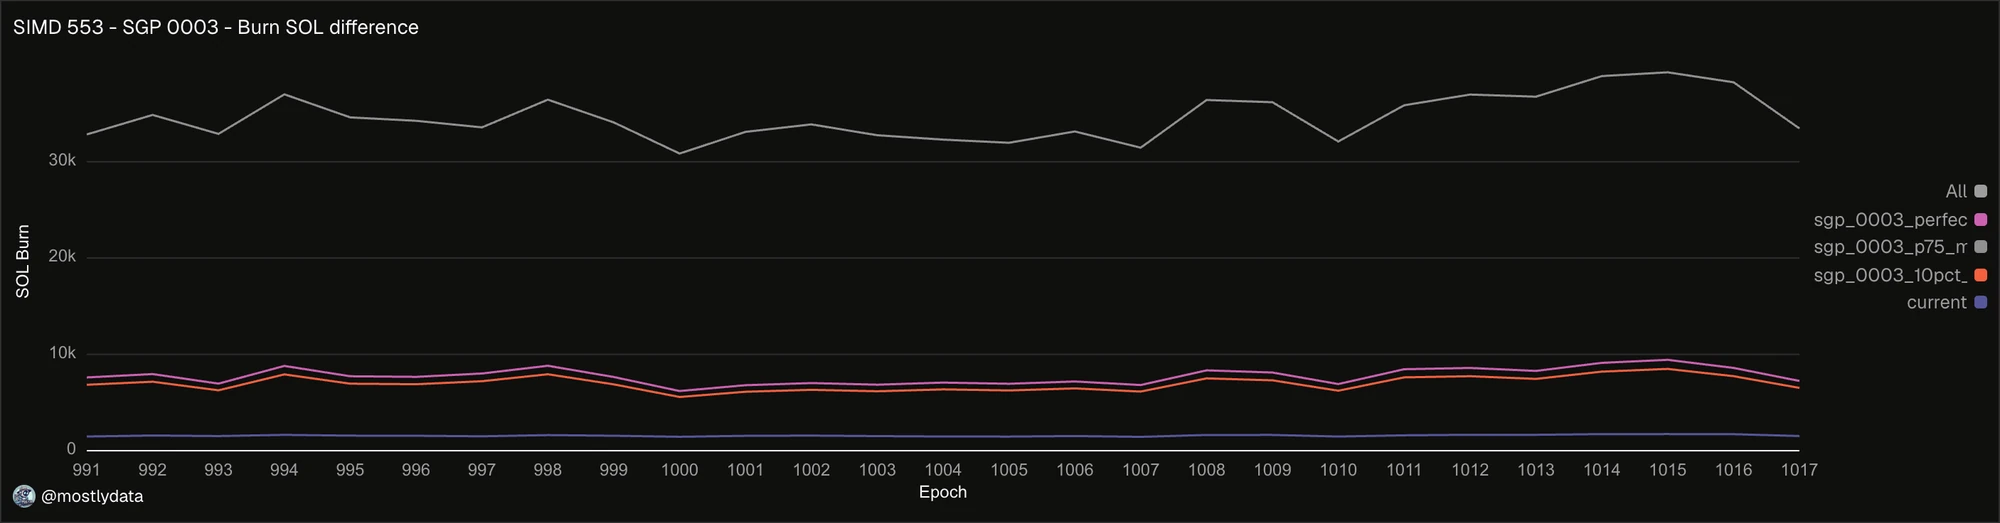
SOL burn rate under SGP-0003. Orange line represents the optimized setup, where on average all resources are reduced by 10%. Gray line represents the current cost units usage with an excess in requested resources equal to the p75 of excess showed by txs specifying both CU and loaded data size. Pink line represent the current Cost Unit consumption with no excess. Blue line is the current burn rate.
Introduction
SGP-0003 represent a radical change into SOL tokenomics. The proposal want to make Solana’s base fee resources-aware. The new base fee is decomposed into a flat fee plus a fee which scales with the amount of resources a transaction requests.
The main goal of this document is to provide all data needed to make an informed decision. The goal is not to pick a side, but make all implications visible.
Are Requested Resource Calibrated?
When the scheduler accepts a transaction, it reserves the requested cost of that transaction. Only after execution, once cost consumed are known, the excess can be allocated again to the block CU budget.
Despite this is already something to focus on when reasoning about resource miscalibration, there is more.
Transaction prioritization is defined from fee paid per requested cost. This means that, an excess in CU request is actually lowering the priority of a transaction, making it difficult to build efficient blocks where resources are priced correctly.
These two features offset to zero the benefit of v1 format, where "value of transaction" is known ex-ante.
As of today, the real benefit of properly pricing CU might be hidden by the long wall-clock time of slots and their abundance of unused space. In the future, this may be much more noticeable.
But at this point we need to look at current snapshot.
Figure 1 shows the Cumulative Distribution Function of Cost Unit excess (requested minus consumed) per transaction, where transactions are grouped by the one with explicit CU and load data size (grey line), explicit CU but no load data size (pink line), explicit load data but no CU (orange line), use default for both (blue line).
Fig.1: Distribution of Cost Unit excess per transaction. Here we display the CDF of Cost Unit excess (requested minus consumed) per transaction grouping txs that explicit CU and load data size (grey line), explicit CU but no load data size (pink line), explicit load data but no CU (orange line), use default for both (blue line). The value on y-axis represents the probability to find a tx with a Cost Unit excess lower than the value on the x-axis. Figure shows how txs with no explicit CU and load data size are the one with the highest excess of Cost Unit. Source: Dune.
It’s clear that transactions with no explicit CU or load data size are the one showing the highest excess of Cost Unit requested.
In terms of transactions topology, data show:
- 48.6% of transactions explicitly set CU and loaded data size limit s
- 43% of transactions explicitly set CU limit and use default loaded data size limit
- 8.4% of transactions use defaults limits for CU and loaded data size limits
- there is a tiny amount of transactions, 10 out of 2.4B scrutinized, which specify loaded data size limit but use default CU limit.
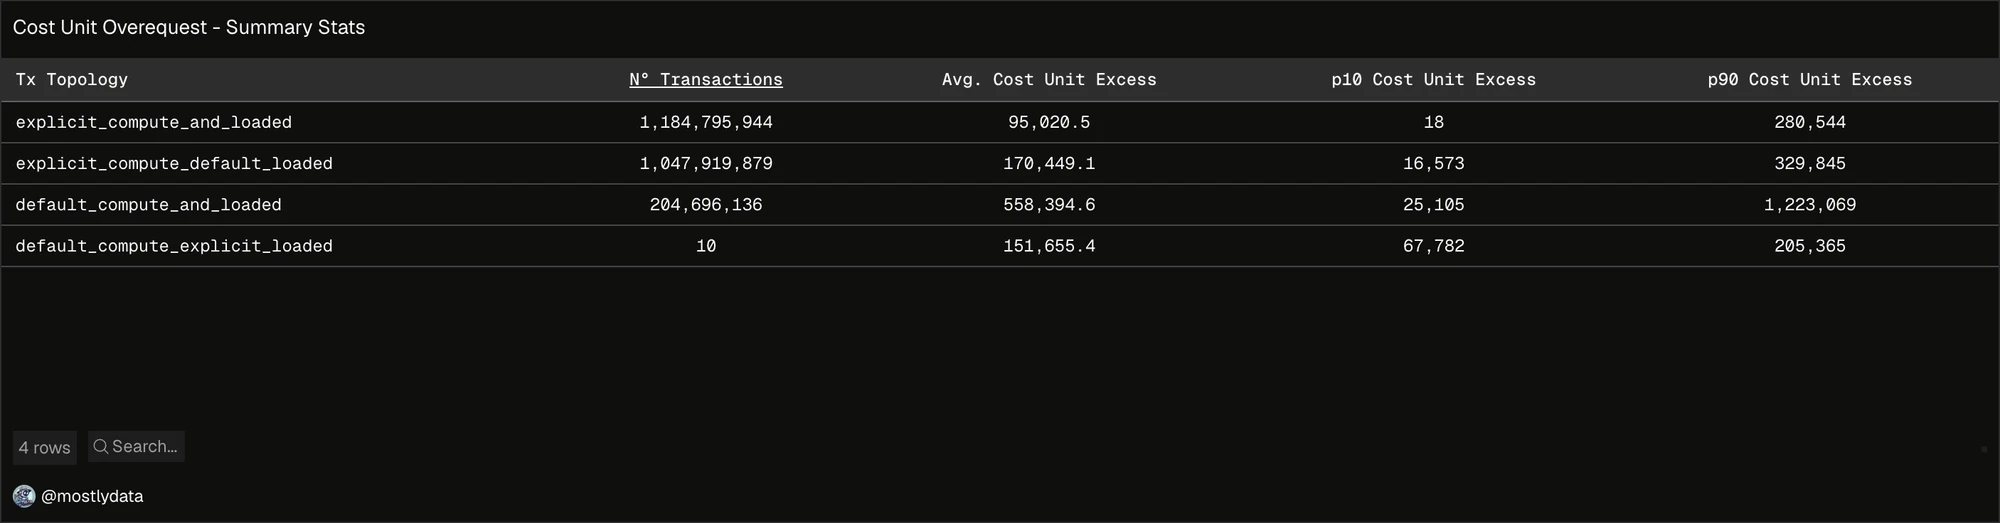
Fig. 2: Summary statistics of Cost Unit excess for each transaction topology. Source: Dune.
Transactions that specify both CU and loaded data size limit see an average excess of ~95k, with a p90 of ~280k. If the excess in request is due to unknown on modeling of needed resources, this will cost on average ~45000 lamports more.
This is not a small increase. Assessing if developers can actually move down excess in requests is not trivial: we can’t estimate the effects on daily operations.
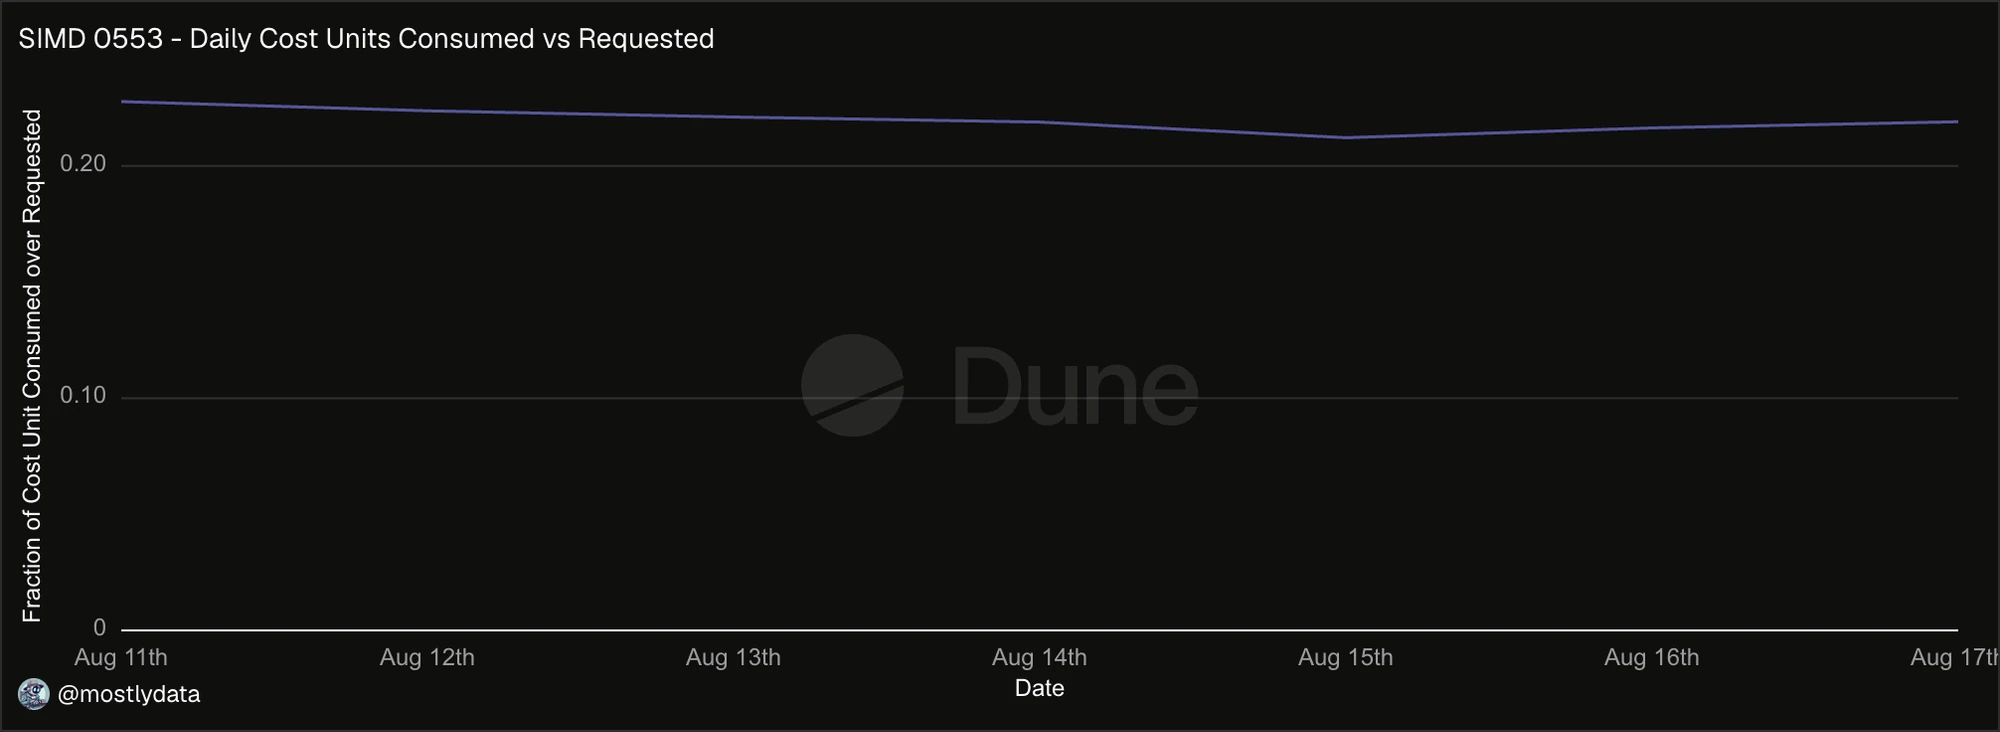
Fig. 3: Fraction of Cost Unit Consumed over Requested. Source: Dune.
Figure 3 shows that as of today, Cost Units really consumed represent ~20% of Cost Unit requested. This indicate that there is a huge room for improvement.
Impact on Transaction
At this point it is mandatory to look directly at implications on transactions.
Here, for the sake of simplicity, we can assume that Solana network moves into a well optimized regime and there is no excess in requested cost units.
Fig. 4: Distribution of the base fee increase with SGP-0003. Here we display the CDF of base fee increase expressed as percentage. The value on y-axis represents the probability to find a tx with a percent increase on base fee lower than the value on the x-axis. Source: Dune.
If we condensate the global snapshot under a CDF, we can see how transactions can experience a material increase post SGP 0003 (assuming Cost Unit will stay the same). Only ~28% of transactions will see an increase lower than 10%.
This represents a meaningful barrier, and developers need to assess implications for their operations.
At this point, we can’t really look inside all transaction. However, we can move forward by breaking down implication for major categories.
Payments
Payments are coming on-chain, and Solana is highly competitive in this sector.
What is the implication of this proposal on payments?
To answer this question, we check the fee increase for
- normal transfer
- account creation.
The results of distribution in SOL increase is displayed in Fig. 5 and Fig. 6.
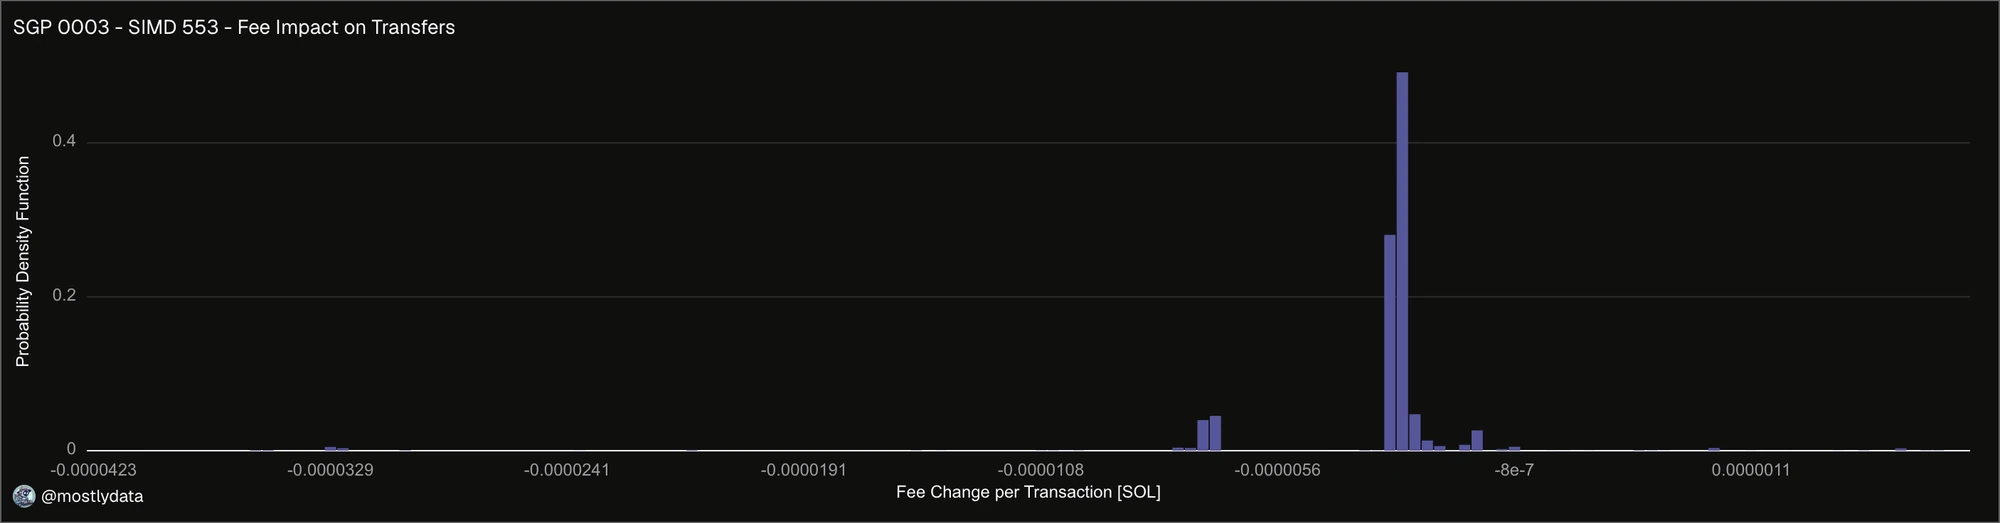
Fig. 5: Fee impact on Transfer. Distribution of SOL increase in base fee per transaction. Source: Dune.
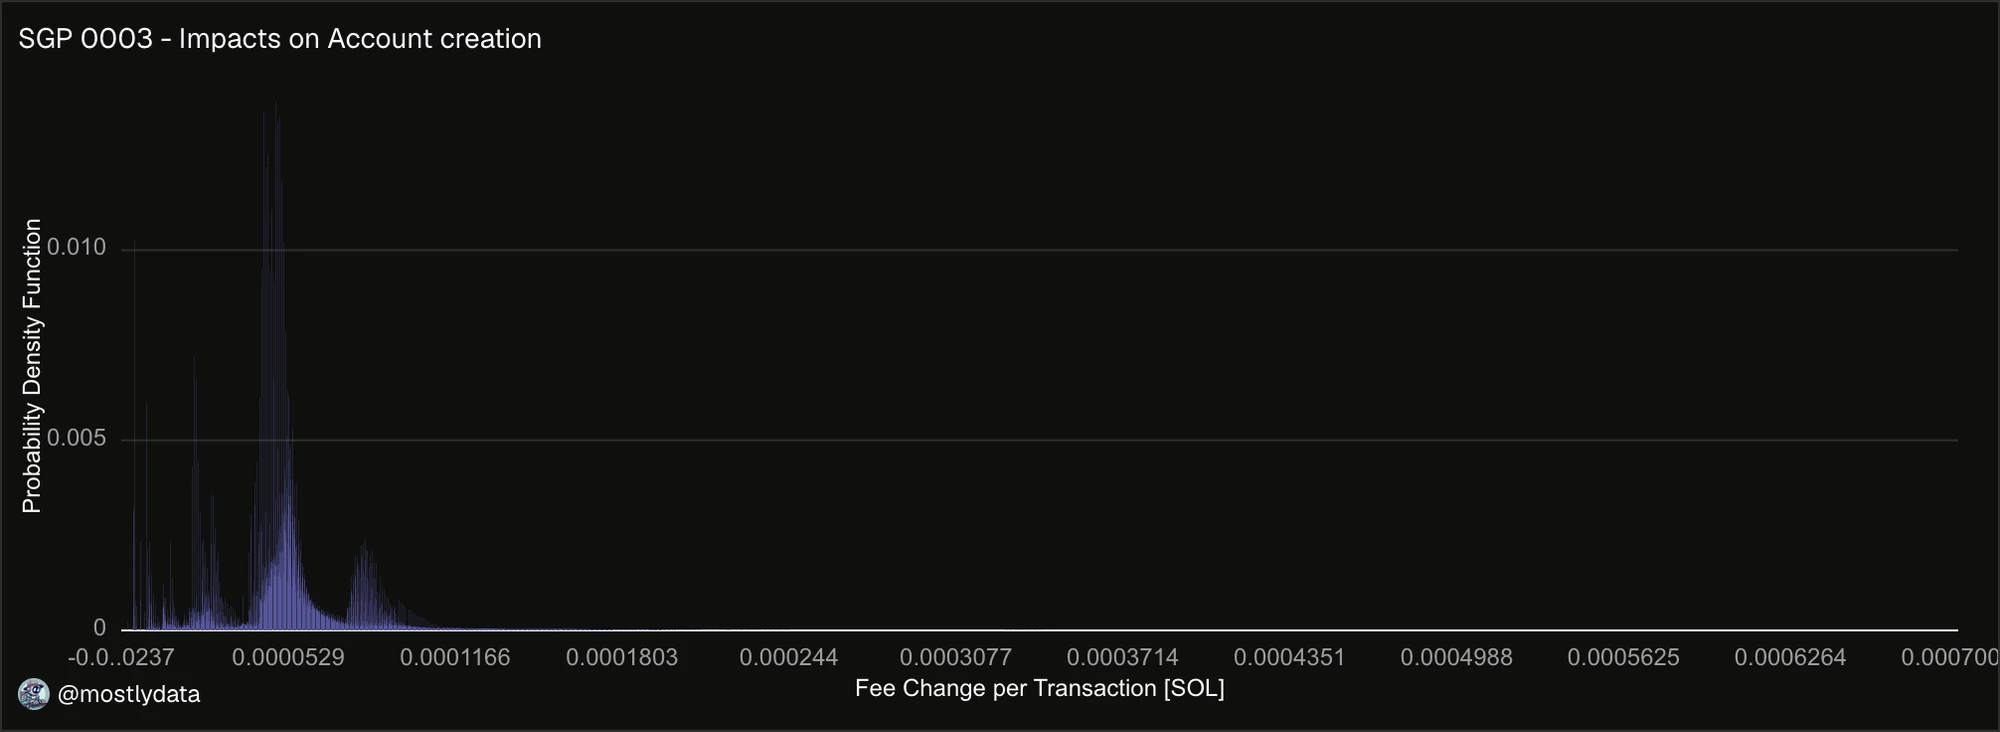
Fig. 6: Fee impact on account creation. Distribution of SOL increase in base fee per transaction. Source: Dune.
Generally, transfers will see a reduction in base fee. The bulk of the distribution is around -0.0000017 SOL per transaction. This is a tiny amount, so the tl;dr is that general transfer are not affected much.
The situation is different for account creation. The bulk of the distribution is around 0.00005 SOL per transaction. This is still materially lower than the 0.0002 SOL in rent forecasted after rent reduction is live.
propAMMs Market Making
One of the key innovations on Solana is the rising of propAMMs. These unlocked new functionalities, allowing Solana to be very competitive with external venues on spot trading.
To assess implications on propAMM operations, we collect all oracle updates and estimate the impact on base fee after SGP-0003.
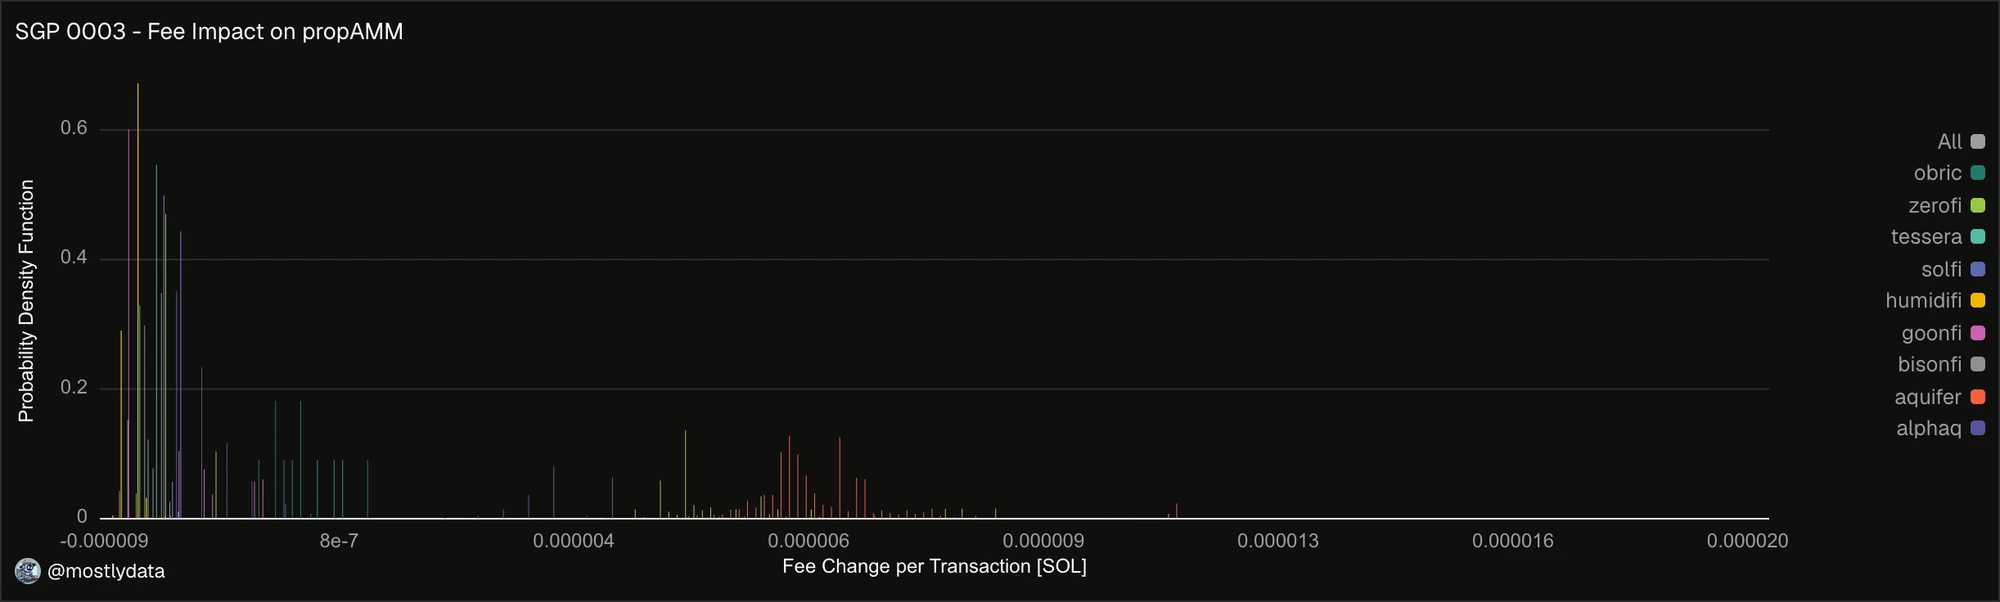
Fig. 7: Distribution of base fee change after SGP-0003 for propAMMs’ oracle updates. Source: Dune.
Here the impact is not uniform among propAMMs.
We see that there are propAMMs like BisonFi, Tessera, HumidiFi, SolFi, GoonFi that will see a reduction on base fee. Other, like Aquifer, will see the bulk of the distribution around 0.000006 SOL increase per transaction. ZeroFi shows a mixed behaviour.
In general, despite the increase for some propAMM seems small, multiple updates per slots may drastically increase operations costs.
However, the majority of propAMMs’ oracle updates will result in a lower amount of fee paid in base fee.
CLOBs Market Making
CLOBs are still one of the most important primitives when discussing market activity. These require market makers to constantly update their view of the book.
To estimate the implications on CLOBs activity, we tracked market maker orders on Archer, Phoenix DEX, and Phoenix Perp.
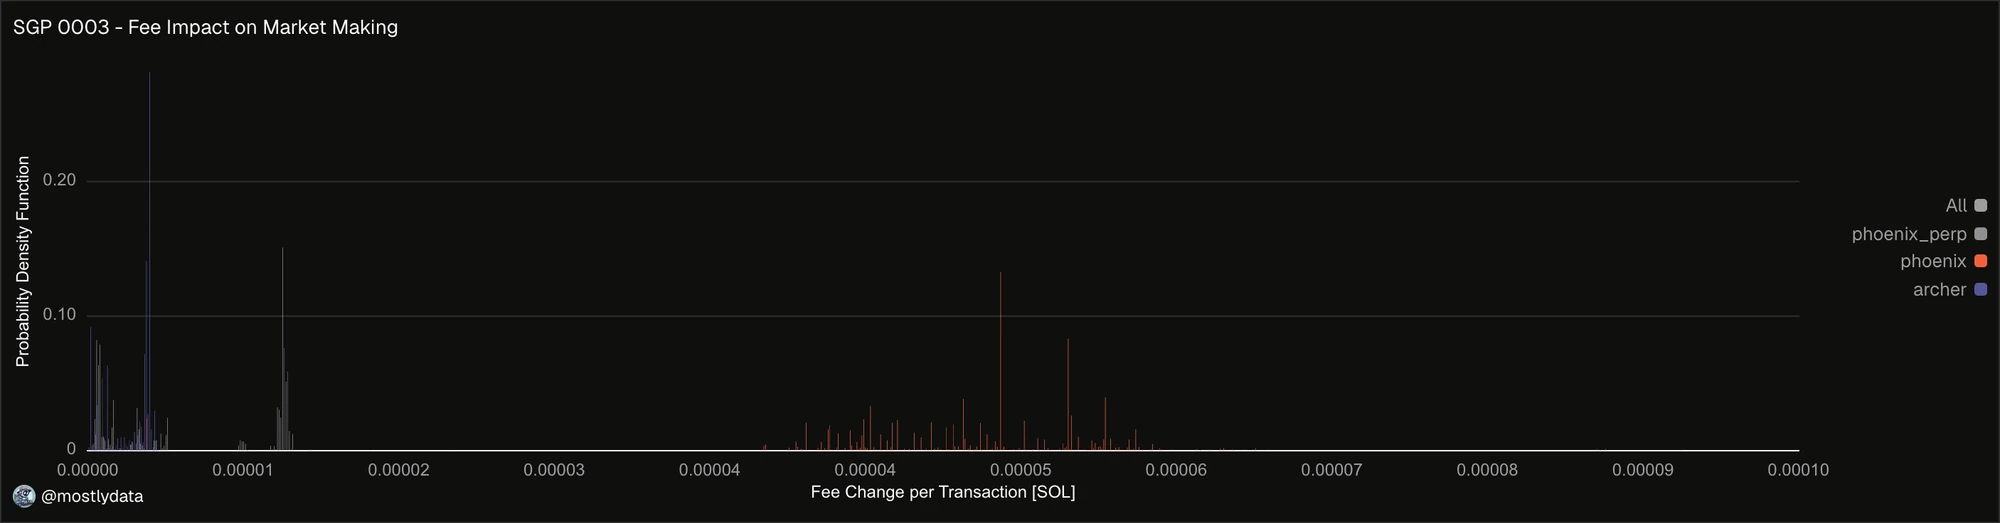
Fig. 8: Distribution of fee difference post SGP-0003 for market making activity. Source: Dune.
What we see is an increase in market making activity, with Phoenix DEX mostly affected.
Archer and Phoenix Perp also show a moderate increase that in principle is not suitable with an intense market making activity.
However, by inspecting transactions, we clearly see multiple updates aggregated together (see eg. exhibit A and exhibit B). This is because updates can get access to the 1.4M CU with the same base fee. Thus here it is mandatory to assess the impact on operations once MMs orders are decoupled.
At this rate, MM activities will see non-negligible impacts on daily operations.
Aggregators
Aggregators are one of the core component of trading activity on Solana.
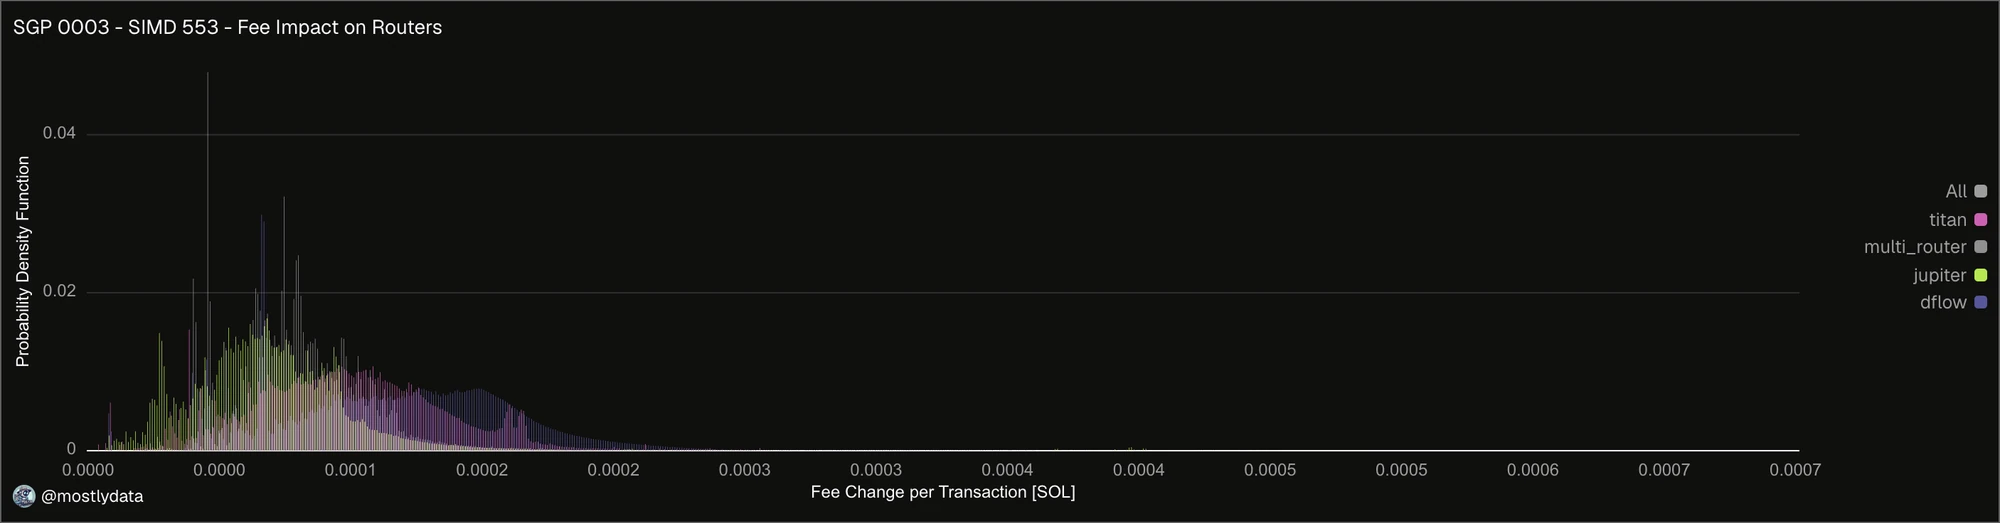
Fig. 9: Distribution of fee increase for Aggregators. Source: Dune.
These are the one mostly affected by this proposal. With current cost unit usage:
- Jupiter will see an average increase of 0.000068 SOL, p10 at 0.000025 SOL and p90 at 0.00010 SOL
- Titan will see an average increase of 0.00010 SOL, p10 at 0.000046 and p90 at 0.00015 SOL
- DFlow will see an average increase of 0.00012 SOL, p10 at 0.000053 and p90 at 0.00018 SOL.
It is clear that more heavy on-chain routing require more in fee.
Toxic Flow
SGP-0003 has an indirect effect on toxic flow.
Today, a significant amount of liquidity involved into on-chain arbitrage flows between propAMM venues. These trades profits from very tiny prices differences. Indeed, profit extracted is ridiculously low with respect to the liquidity used. Source: Dune.
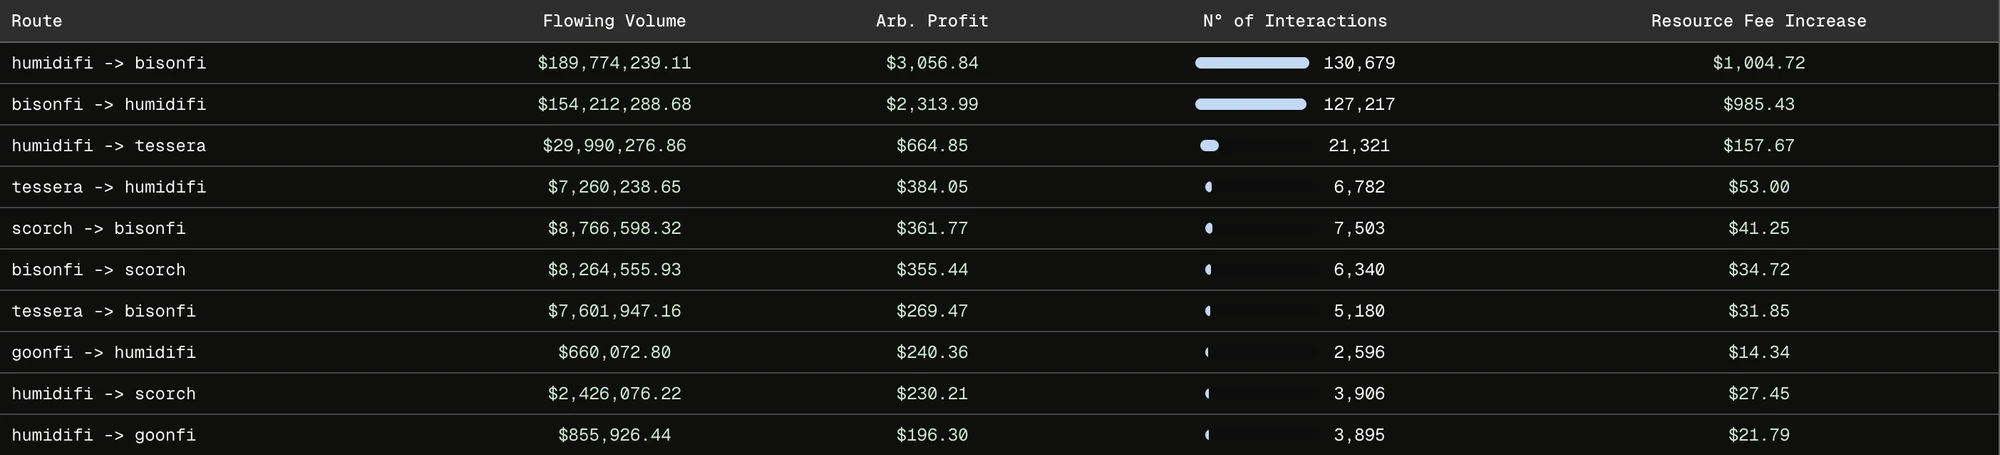
SGP-0003 will increase the cost to extract this value, forcing arbitrage bots to act only if the alpha is high enough.
Impact on Validators
Here the impact is twofold.
On one side, validators will pay less in vote fee (with a 12.3% reduction). Indeed, assuming 3765 requested cost, under SGP0003 validators will pay
This represents a reduction on both vote cost, and then rewards accrued by validators.
On the other side we have reduction due to decrease of flat fee to 2500 lamports.
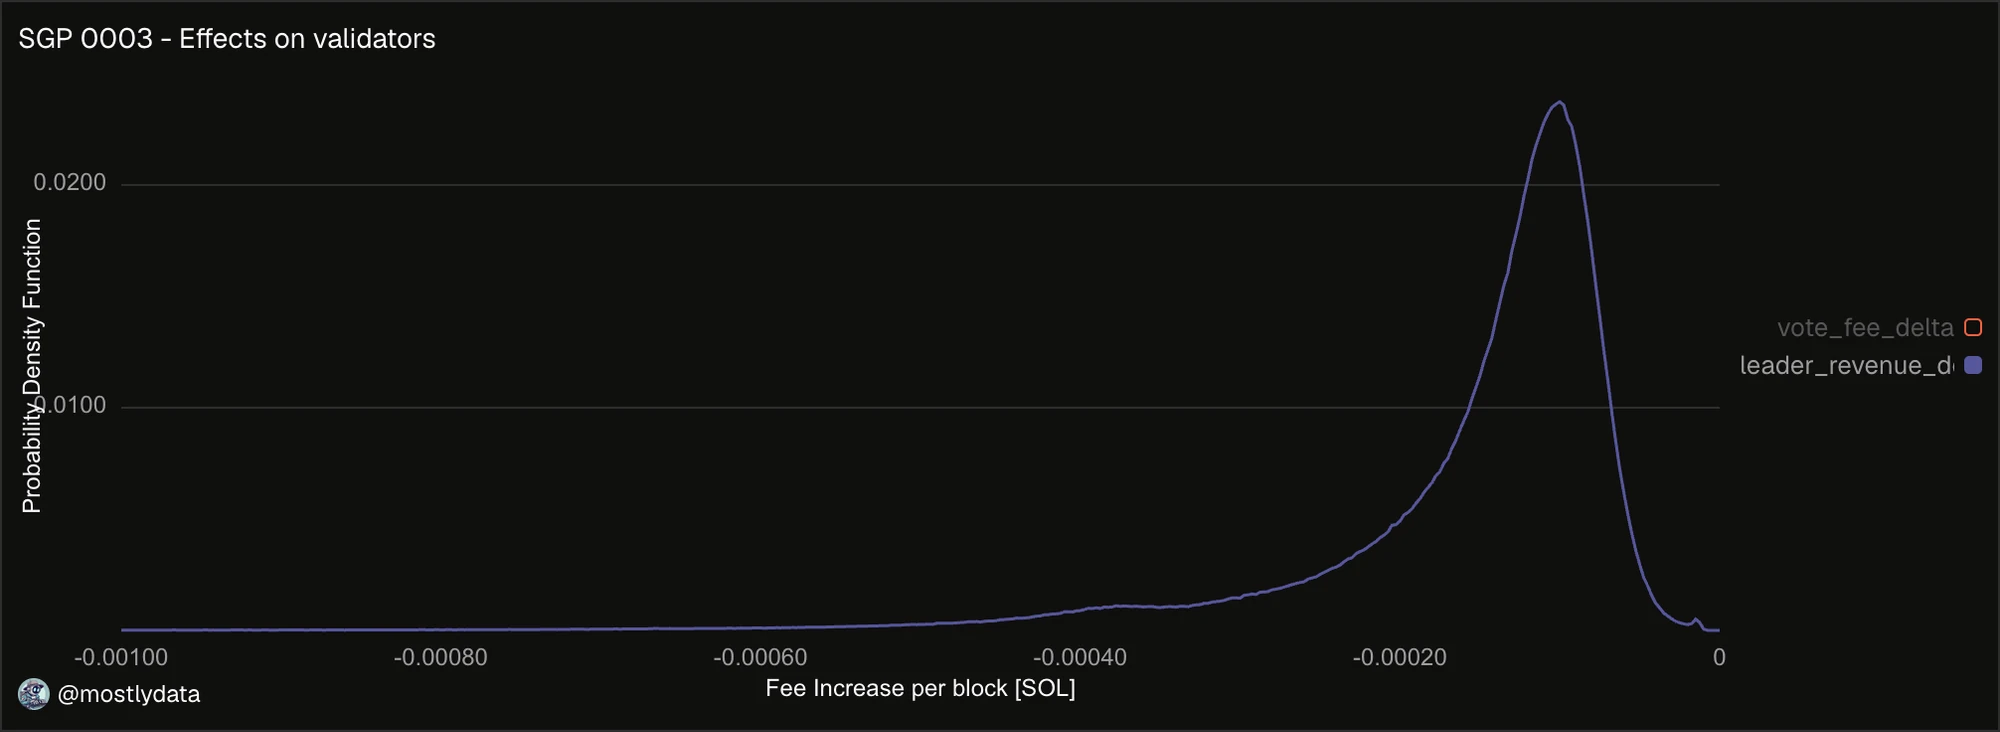
Fig. 10: Change in SOL rewards per block distribution. Source: Dune.
Indeed, under SGP-0003, protocol fee revenue is unchanged for single-signer transactions but decreases for multi-signer transactions. This produces the distribution of losses per block displayed in Fig. 10. Given the current snapshot, the expected value of SOL decrease per block is 0.00015 SOL.
Impact on SOL Supply
The main purpose of this SGP is to increase the burn rate.
To estimate the possible burn rate we assume 3 different case:
- Current Cost Unit consumed with no excess in requested resources
- Current Cost Unit consumed with an excess in requested resources corresponding to the p75 of excess of txs specifying both CU and loaded data size limit
- A 10% average reduction (due to optimization) of current Cost Unit consumed.
Fig. 11: SOL burn rate under SGP-0003. Orange line represents the optimized setup, where on average all resources are reduced by 10%. Gray line represents the current cost units usage with an excess in requested resources equal to the p75 of excess showed by txs specifying both CU and loaded data size. Pink line represent the current Cost Unit consumption with no excess. Blue line is the current burn rate. Source: Dune.
Under these assumption, SOL burn moves from
- Between 30k and 35k SOL per epoch in the worst optimized setup
- Between 8k and 10k SOL per epoch in the no-excess case
- Between 6k and 8k SOL per epoch in the optimized case with no-excess in requested resources.
Clearly, these numbers are speculative because we don’t know how developers will react and what the future resource usage will be.