
TL;DR
- The analysis asks whether Solana can materially reduce the rent-exempt requirement.
- There is no evidence of an immediate risk of state growth: the tied-up capital needed for a state-bloat attack remains high.
- Current rent appears to contain substantial economic headroom.
- Short-term account demand is only weakly related to changes in the USD-denominated cost of rent.
- Most gross account-state allocation is transient rather than persistent.
- Recent net storage growth remains moderate.
- Lower rent would materially reduce onboarding costs for account-intensive applications, particularly payments.
Introduction
State growth is one of the fundamental scalability constraints of a high-throughput blockchain. Unlike transaction throughput, account state is persistent: every validator must continuously store, index, snapshot, and maintain it. Consequently, excessive state growth impacts not only storage capacity, but also I/O, snapshot generation, restart times, and long-term validator operating costs.
The rent parameters were calibrated under a different operating environment. Since then, validator hardware, operational experience with AccountsDB, and the economic value of SOL have all changed substantially. Consequently, it is reasonable to revisit whether the current rent remains calibrated to the infrastructure constraints it is intended to protect.
Rent reduction has been discussed in
- SIMD 0389 - Reduce Account Creation Cost and Introduce Supervisory Controller
- Discussion #399
- SIMD-0437: Incremental Reduction of lamports_per_byte to 696
How Much Capital Would a State-Bloat Attack Require?
Under the assumptions of the model described here, a tenfold reduction in the rent-exempt requirement would still require approximately $17 million of capital to consume the currently available AccountsDB storage headroom. By doubling current recommended requirements (2TB), this goes to $51 million of capital. This is a meaningful deterrent, but it is a capital requirement rather than a guaranteed economic loss, and it does not account for potentially external attacker payoffs.
A lower rent-exempt requirement reduces the capital that users must immobilize to maintain legitimate state. The same reduction, however, also lowers the capital required to keep malicious state live. The relevant security benchmark is therefore the amount of capital needed to expand AccountsDB enough to materially strain validator infrastructure.
For an economically motivated attacker, the basic deterrence condition is:
where is the benefit obtained if the attack succeeds and is the associated economic burden.
In the case of a state-bloat attack, the term “cost” requires some care. The rent-exempt balance is not normally burned: it is capital locked inside the accounts and can generally be recovered when those accounts are closed. The relevant quantity is therefore better described as a capital requirement, together with its opportunity cost, execution fees, and any portion of the principal that may not be recovered.
A state-bloat attack does not offer an obvious protocol-native payout. Disrupting or halting the network does not directly transfer value to the attacker. Nevertheless, the potential benefit cannot be assumed to be zero, since it may arise externally through short positions, derivatives, liquidations, extortion, competitive advantage, or non-economic objectives. The purpose of the following model is therefore not to prove that an attack is unprofitable, but to estimate whether rent continues to impose a substantial economic barrier.
A simple attack-cost benchmark
Let the commodity storage cost be:
Assuming that persistent state is replicated across approximately 1,000 validators:
Applying a safety multiplier for operational overhead and economic deterrence gives:
or approximately
This is not intended to represent the exact marginal infrastructure cost imposed by one additional byte. It is a conservative benchmark for the economic barrier that rent should maintain.
Comparison with current rent
Figure 1 shows the evolution of average USD price per byte, with current rent-exempt requirement at approximately
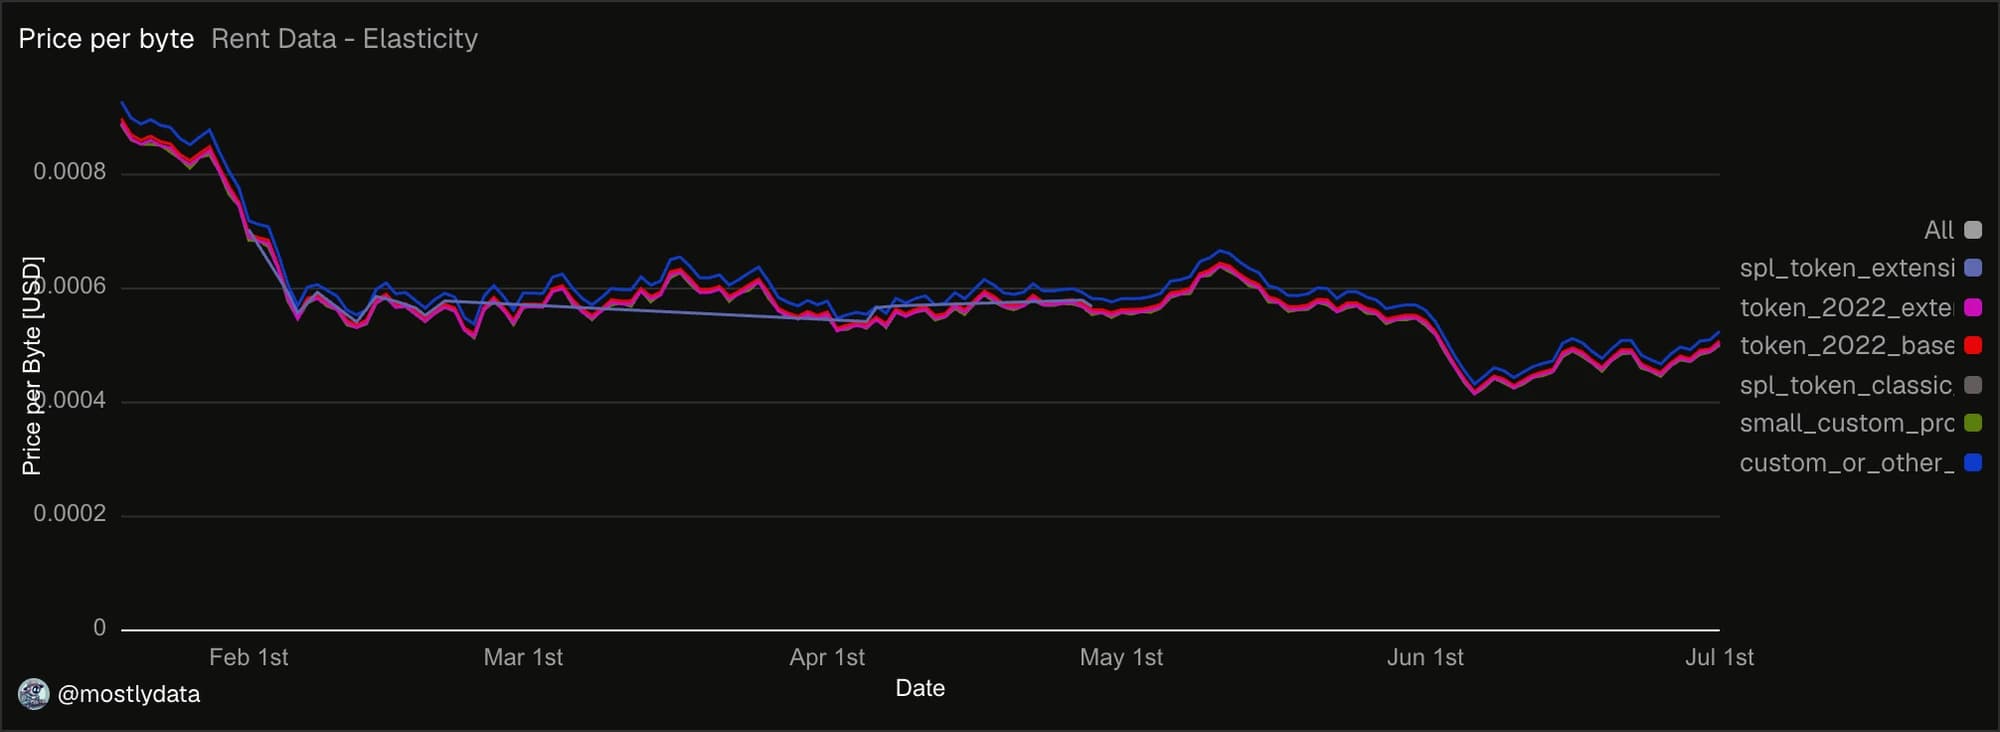
Fig.1: USD price per byte stored on Solana. Source: Dune query.
It follows that
Thus, under these assumptions, a tenfold reduction in the rent-exempt requirement would bring the capital requirement close to the benchmark derived above.
How much capital would a state-bloat attack require?
The current AccountsDB storage files occupy approximately 495 GB (see Fig.2), against a recommended capacity of 1 TB. The remaining storage-file headroom is therefore
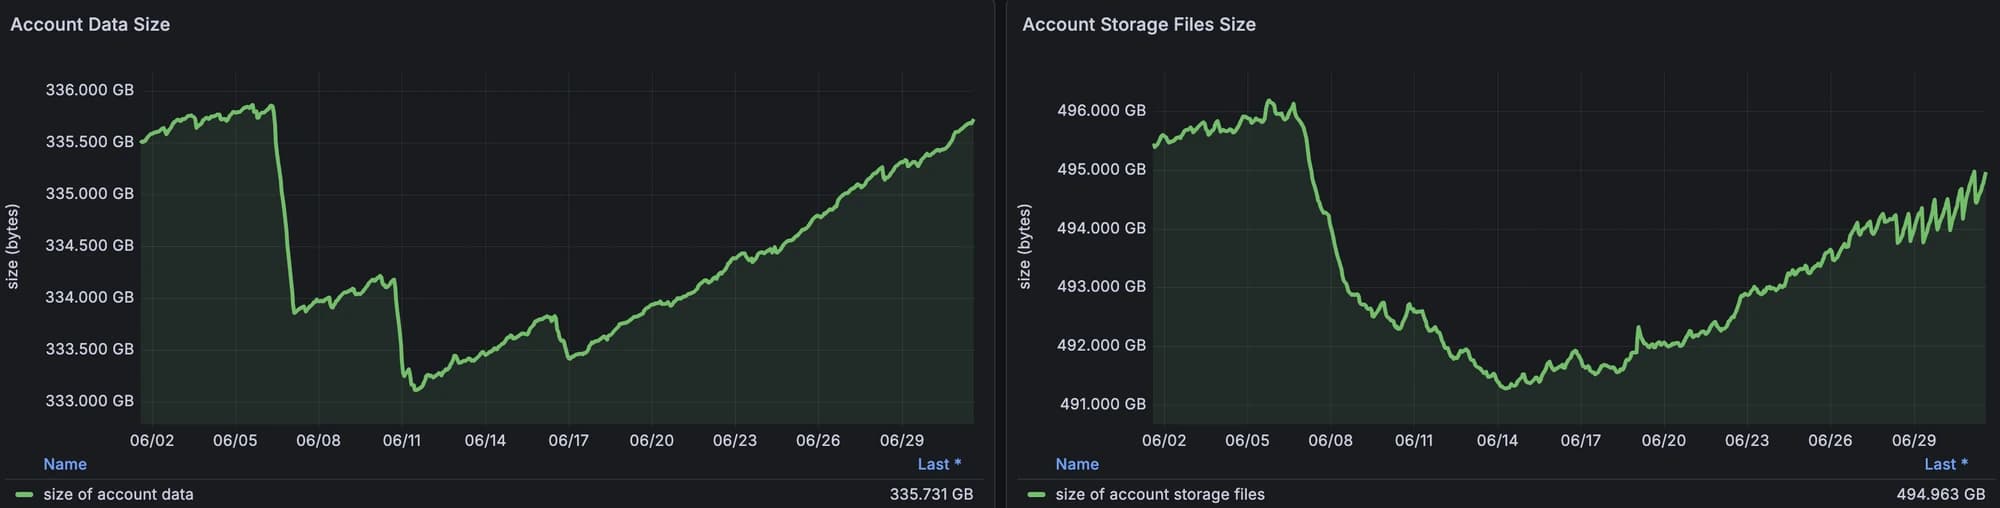
Fig.2: Left: total live account data (accounts_data_len), measuring the cumulative size of account data currently stored on-chain. Right: total AccountsDB storage footprint (accounts_db-stores.total_bytes), including the physical storage occupied by AccountsDB files.
However, rent is paid on allocated account state rather than directly on AccountsDB storage-file bytes. Using the currently observed storage amplification (see Fig.2):
the corresponding additional live account state would be:
At the reduced rate
This capital would need to remain locked for as long as the malicious state remains live. The rent-exempt reserve is generally recoverable when an account is closed. It should therefore be interpreted as capital at risk or capital immobilized, rather than as an irreversible fee.
What Is Actually Driving Solana State Growth?
The attack-cost model provides a theoretical bound on the capital required to maintain malicious state. We now turn to the observed behaviour of account state under normal network activity.
Does Account Activity Respond to the Cost of State?
Account creation does not appear to respond mechanically to short-term changes in the USD cost of state. The observed correlations are weak and regime-dependent, although they do not provide a causal estimate of the effect of changing the rent parameters.
This is a relevant question since if account creation responds strongly to the USD-denominated cost of rent exemption, reducing rent could accelerate state growth. If the response is weak, short-run growth is more likely to be dominated by application-specific demand.
The rent-exempt requirement is denominated in lamports, but its effective USD value changes with the price of SOL. We use this variation as a first descriptive test of whether account activity responds to changes in the USD cost of maintaining state.
Over the last 30 days, the relationship between SOL price and the number of accounts appears weak. When computed on 1-hour percentage changes, the 24-hour rolling correlation fluctuates around zero, with no persistent positive or negative regime (cfr. Fig.3). This suggests that short-term account-count dynamics are not strongly explained by simultaneous movements in the SOL price.
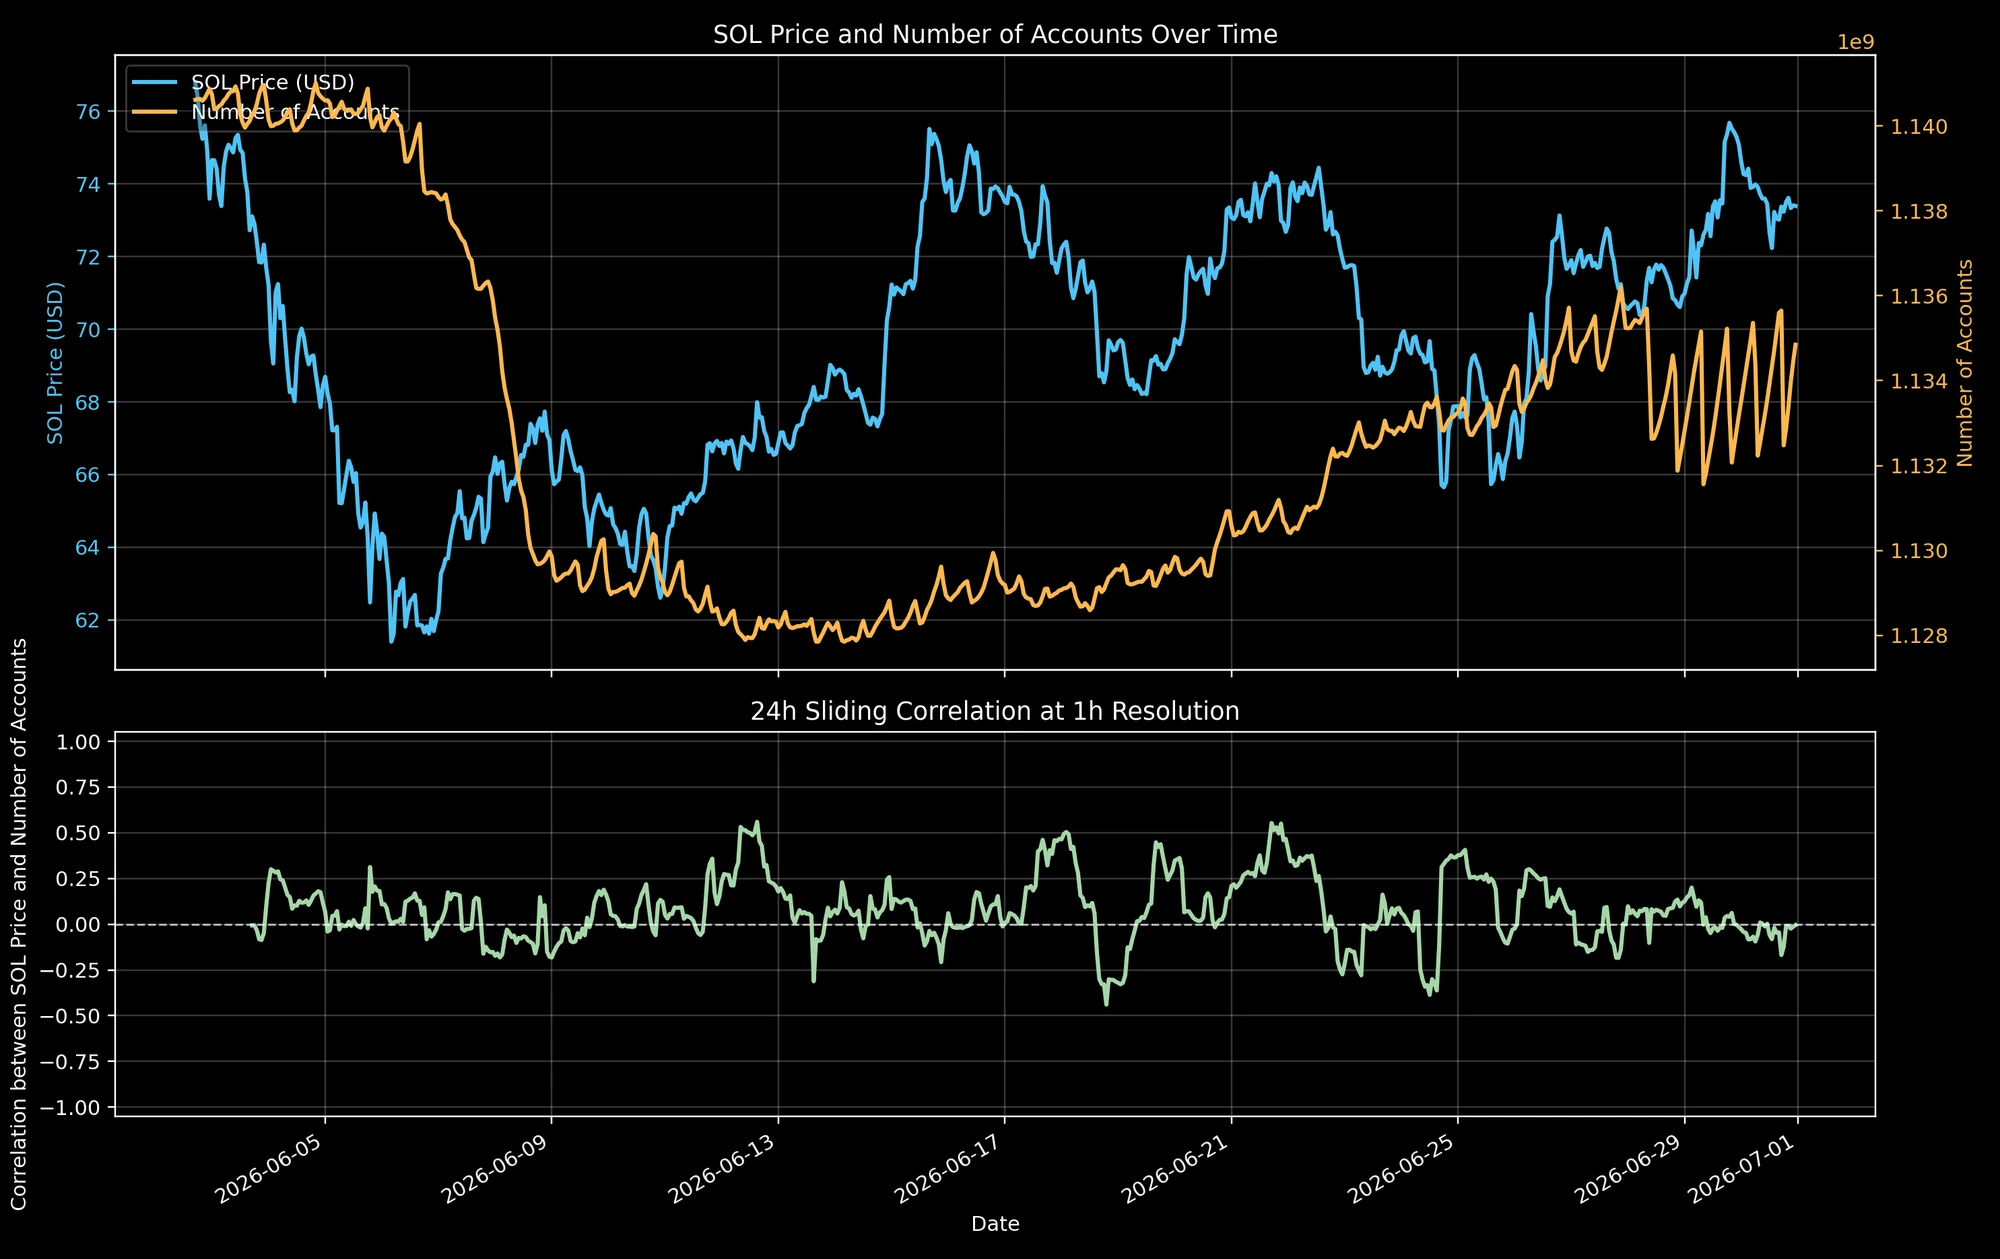
Fig.3: Top: SOL price denominated in USD compared with N° of Accounts. Bottom: 24h rolling correlation at 1h resolution.
A lagged comparison provides a more nuanced picture, see Fig.4. In particular, the sharp decline in SOL price at the beginning of the sample is followed, with some delay, by a marked reduction in the number of accounts. Similarly, the subsequent recovery in SOL price is broadly followed by a recovery in account count. However, the lagged rolling correlation remains unstable and oscillates over time, indicating that the relationship is not stationary and should not be interpreted as a simple linear dependence.
The data therefore suggest some low-frequency co-movement, but not a stable lead–lag relationship that can be summarized by a single correlation coefficient.
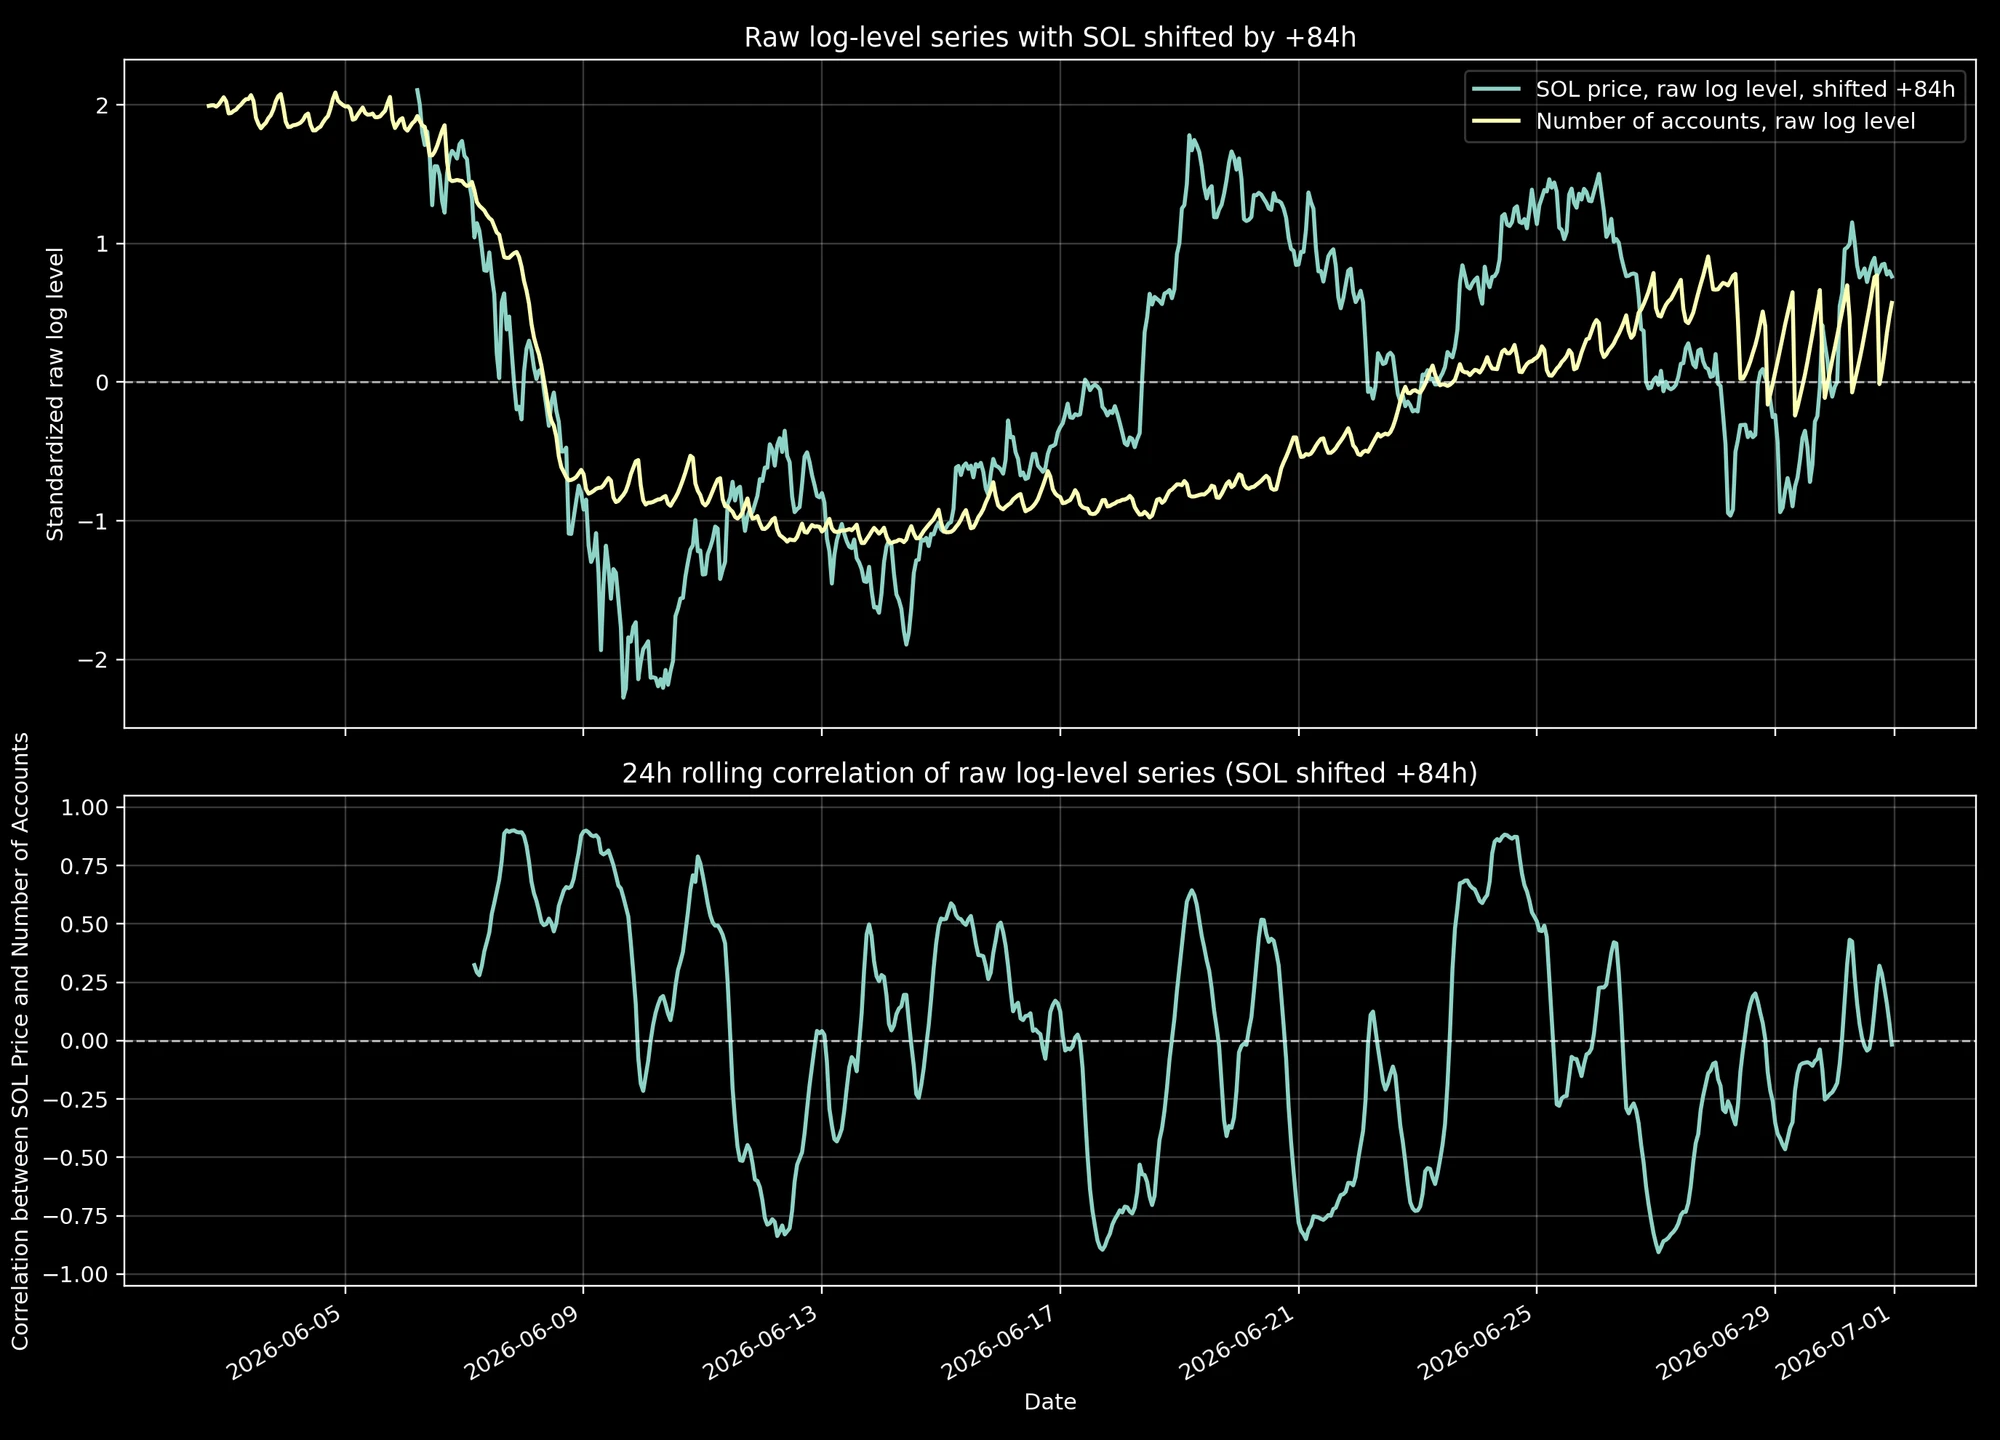
Fig.4: Top: SOL price denominated in USD and shifted by 84h compared with N° of Accounts. Bottom: 24h rolling correlation at 1h resolution.
We next compare daily changes in the rent price per unit of account state with the daily percentage change in newly created accounts (not-deduplicated), split across account categories.
The scatter plot in Fig.5 shows no clear linear relationship. Most observations are concentrated around small rent-price changes, while account creation remains widely dispersed across categories. Even when the USD cost of state changes materially, the corresponding response in new account creation is heterogeneous.
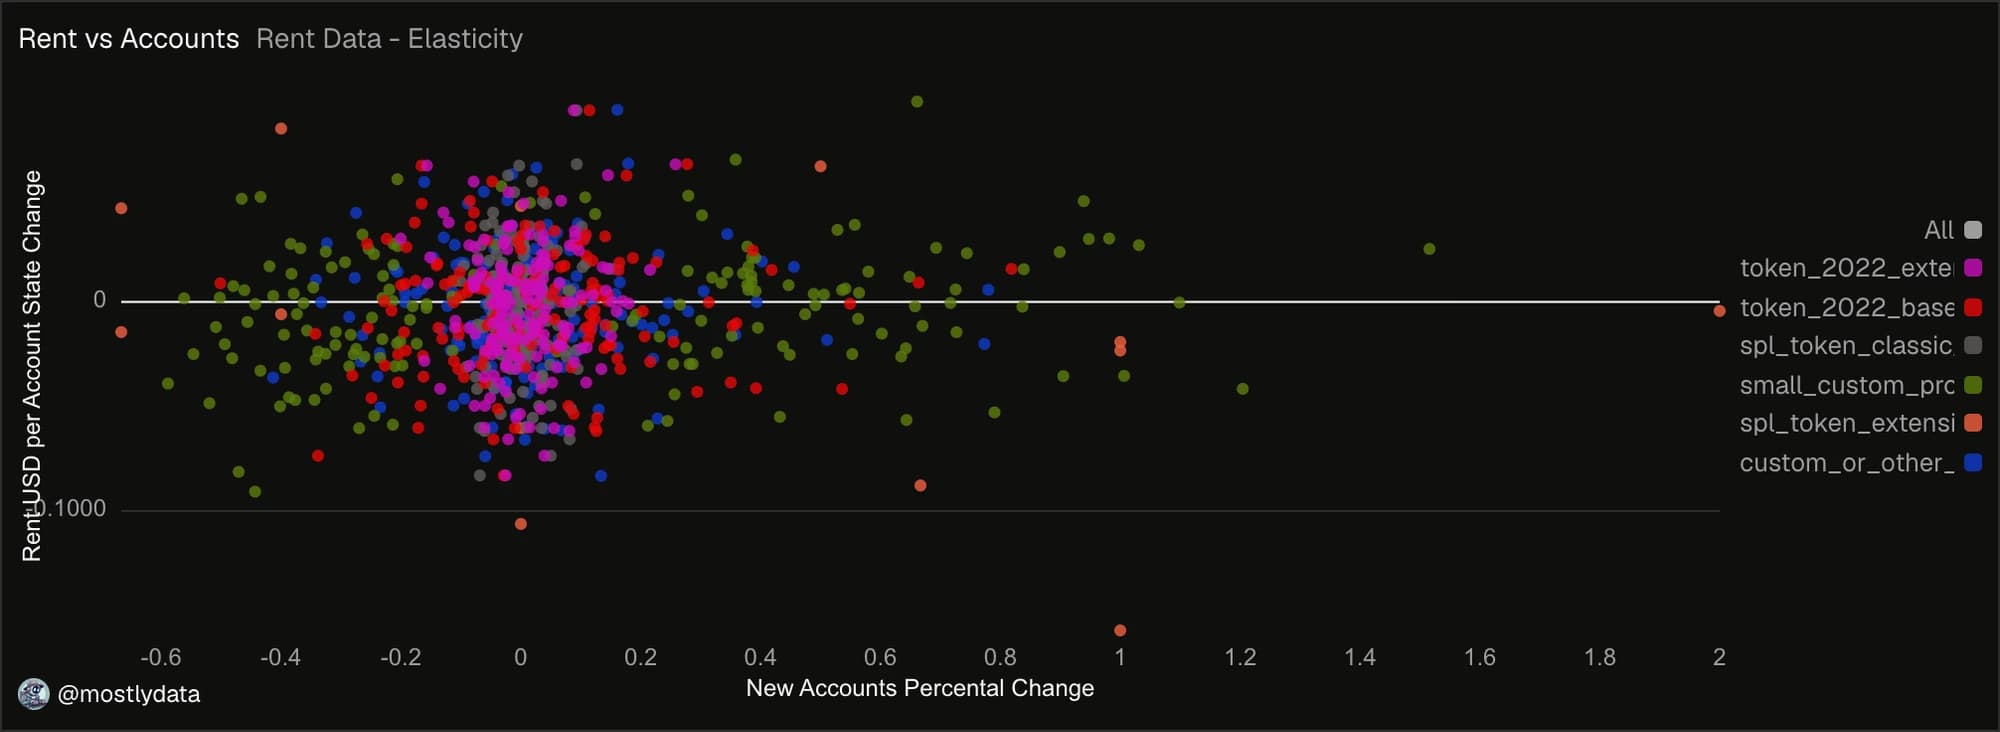
Fig.5: Scatter plot of daily change in USD per account state vs new account creation (not-deduplicated). Source: Dune query.
The 30-day rolling correlations support the same interpretation, see Fig.6. The coefficients change sign over time and occasionally reach moderately positive or negative values, but no account category enters a persistent high-correlation regime.
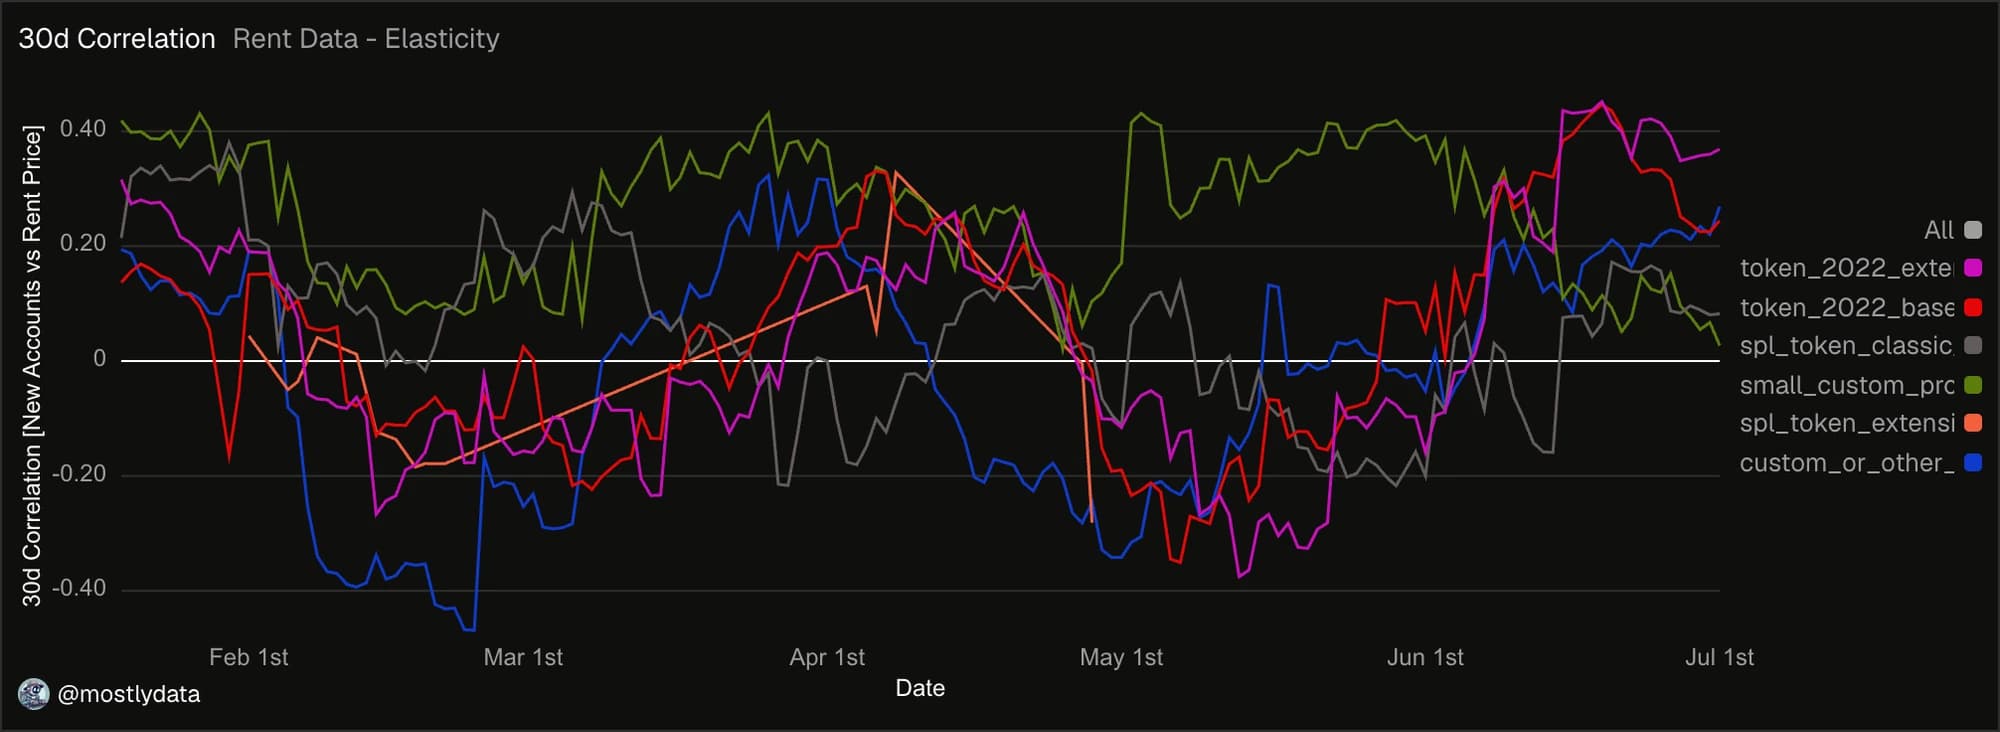
Fig.6: 30 days rolling correlation between daily change in USD per account state and new account creation (not-deduplicate). Source: Dune query.
Thus, at the daily frequency, gross account creation is not tightly coupled to contemporaneous changes in the USD-denominated rent-exempt requirement.
Across both the total account stock and gross account-creation flows, the observed relationship with SOL price is weak and unstable at short horizons. This is consistent with protocol-specific activity and on-chain demand playing a larger role than short-term variation in the USD cost of state.
However, this analysis should not be interpreted as a causal estimate of rent elasticity. SOL-price movements are not an exogenous rent-policy experiment, and the sample does not reproduce the magnitude of a potential policy-level rent reduction. The analysis may also miss delayed responses, nonlinear thresholds, and changes in account lifetime rather than account creation.
Daily State Demand and Account Size Growth
Recent activity requests roughly 10 GiB of new account state per day in gross terms, but gross allocation is not equivalent to persistent storage growth. In the cohort analyzed, 75.5% of account-creation events close in the same transaction. At the 1-million-slot horizon (~4.7 days), approximately 0.61 GiB remains out of an initial estimated 10 GiB, corresponding to a byte-survival share of 5.65%. The most persistent category (small custom-program accounts) represents only a small fraction of gross state demand. After accounting for closures across both new and pre-existing accounts, the net live account-state footprint grows by approximately 0.3 GB per day.
Gross account creation measures the instantaneous demand for state allocation, but it may substantially overstate how much state remains live.
The daily required-space series in Fig.7 measures the amount of account state allocated by newly created accounts. These figures are not deduplicated by account address: each creation event is counted separately, so repeated create–close cycles involving the same address may contribute multiple observations.
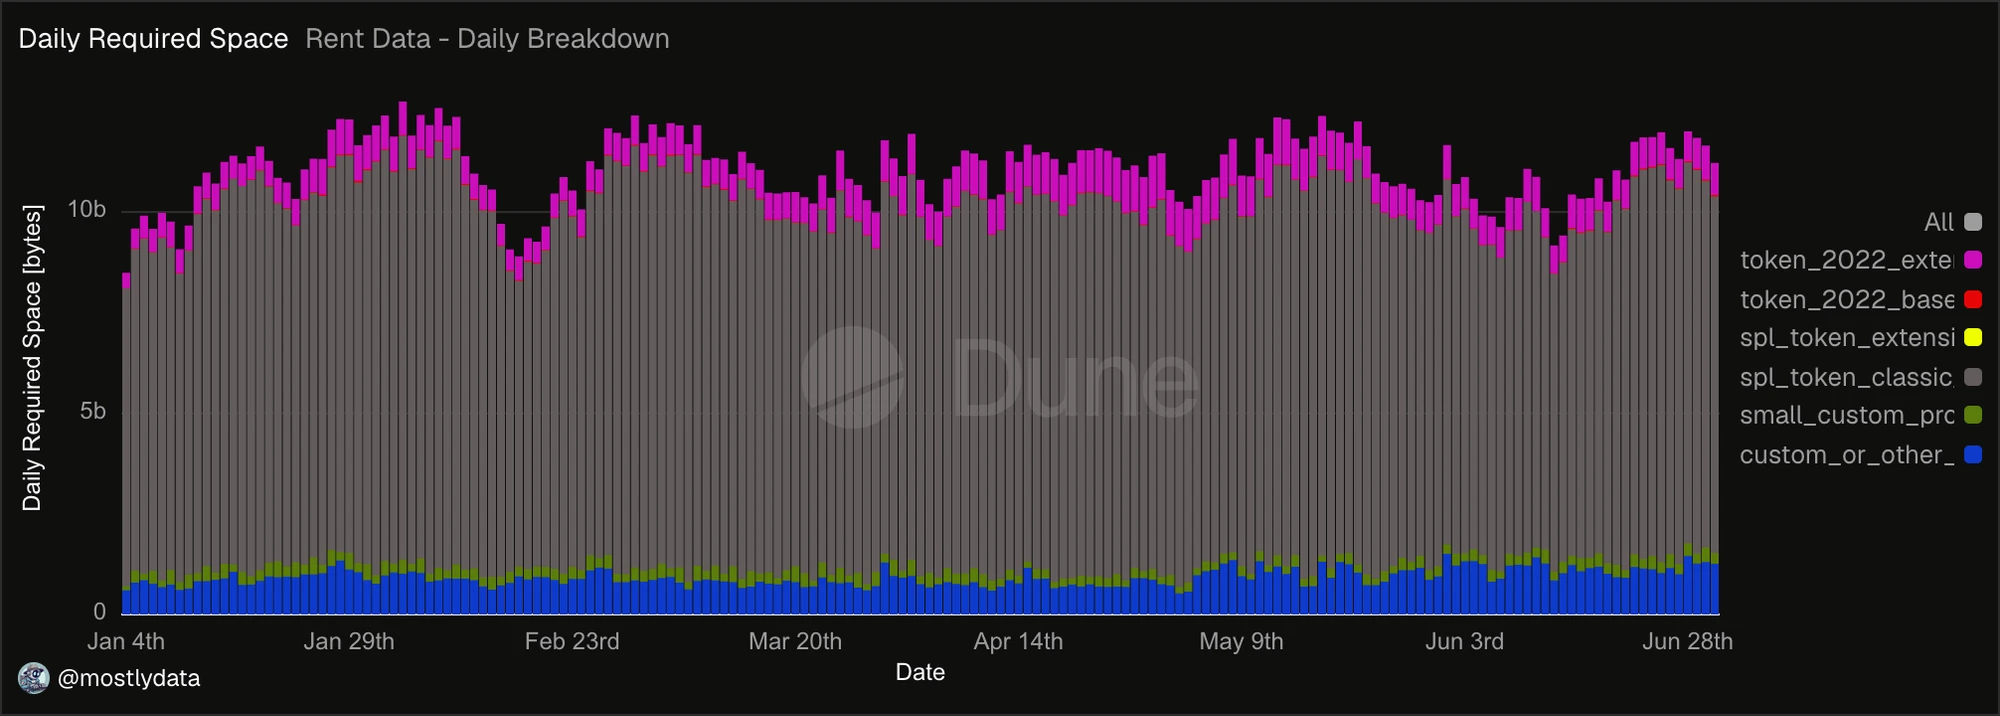
Fig.7: Daily requested space by account creation divided by category. Source: Dune query..
Gross state demand is dominated by token-account activity. On 11 July 2026, for example, newly created accounts requested approximately 10.23 GiB of estimated AccountsDB state:
- SPL Token classic accounts: 8.60 GiB
- custom or other program accounts: 0.79 GiB
- Token-2022 extension accounts: 0.58 GiB
- small custom-program accounts: 0.22 GiB
- Token-2022 base accounts: 0.038 GiB
SPL Token classic accounts therefore represented approximately 84% of gross state demand on that day. However, this flow should not be interpreted as a 10 GiB daily increase in AccountsDB: much of the newly allocated state is closed almost immediately.
We focus only on accounts that were effectively closed during the observation window. For each closed account event, we compute the duration between creation and closure and bucket this duration in days. The figure therefore shows the lifetime distribution conditional on closure, not the survival distribution of all newly created accounts.
The distribution is strongly concentrated in the zero-day bucket: among accounts that are eventually closed, a large fraction is created and closed within the same day, see Fig.8. The remaining mass decays rapidly, with only a small tail of closed accounts surviving for longer periods before being removed.
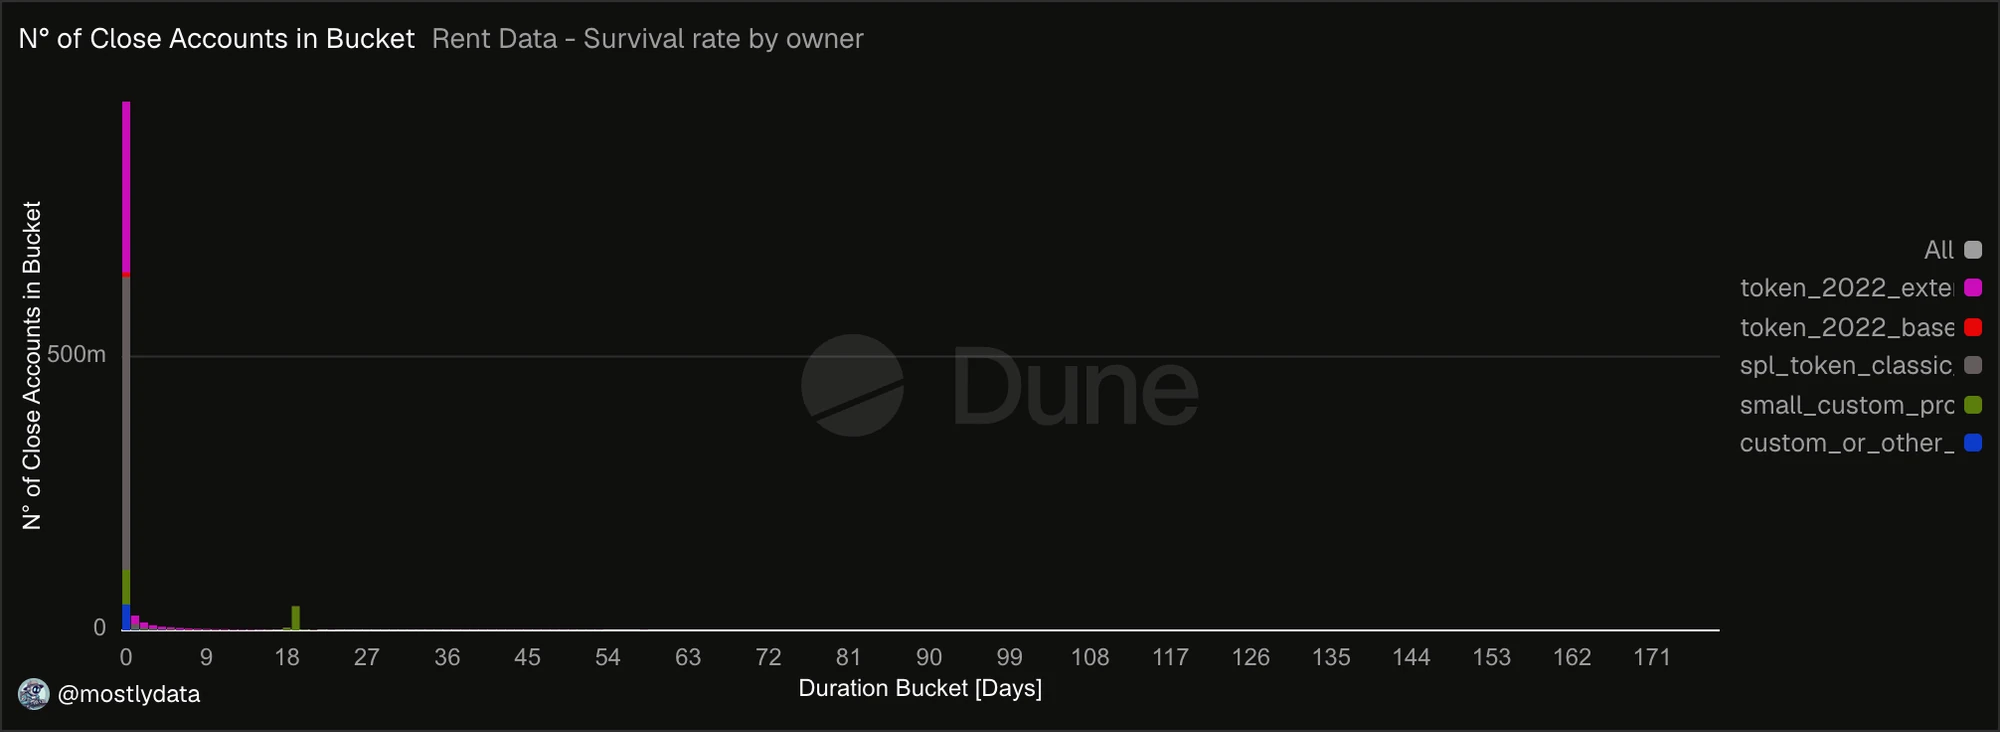
Fig.8: Duration buckets of non-deduplicated closed-account events over the last 180 days. The chart includes only accounts that were effectively closed. Source: Dune query.
These counts are not deduplicated by account address. The histogram should therefore be interpreted as a distribution of account-lifecycle events rather than a distribution of unique accounts. Repeated create-close cycles may contribute multiple observations.
A large fraction of the short-lived account activity appears to be related to trading-driven workflows. In particular, the dominant contributors to this create–close pattern are:
where FD1a…1Dfw9 corresponds to an arbitrage bot that uses idem…PVg3Y to create and close accounts.
The impact of these accounts on the live AccountsDB footprint is limited, because the associated state is mostly transient. When we take a current-state snapshot using getProgramAccounts, the corresponding live account footprint is small: approximately 0.46 GB and 0.0008 GB, respectively. Therefore, while these workflows may generate substantial short-term account churn, they do not materially increase persistent account-state storage.
The broader daily account-creation breakdown in Fig. 9 shows that the largest source of newly created accounts is the SPL Token account category. This indicates that gross account creation is dominated by token-account activity rather than by persistent custom program state.
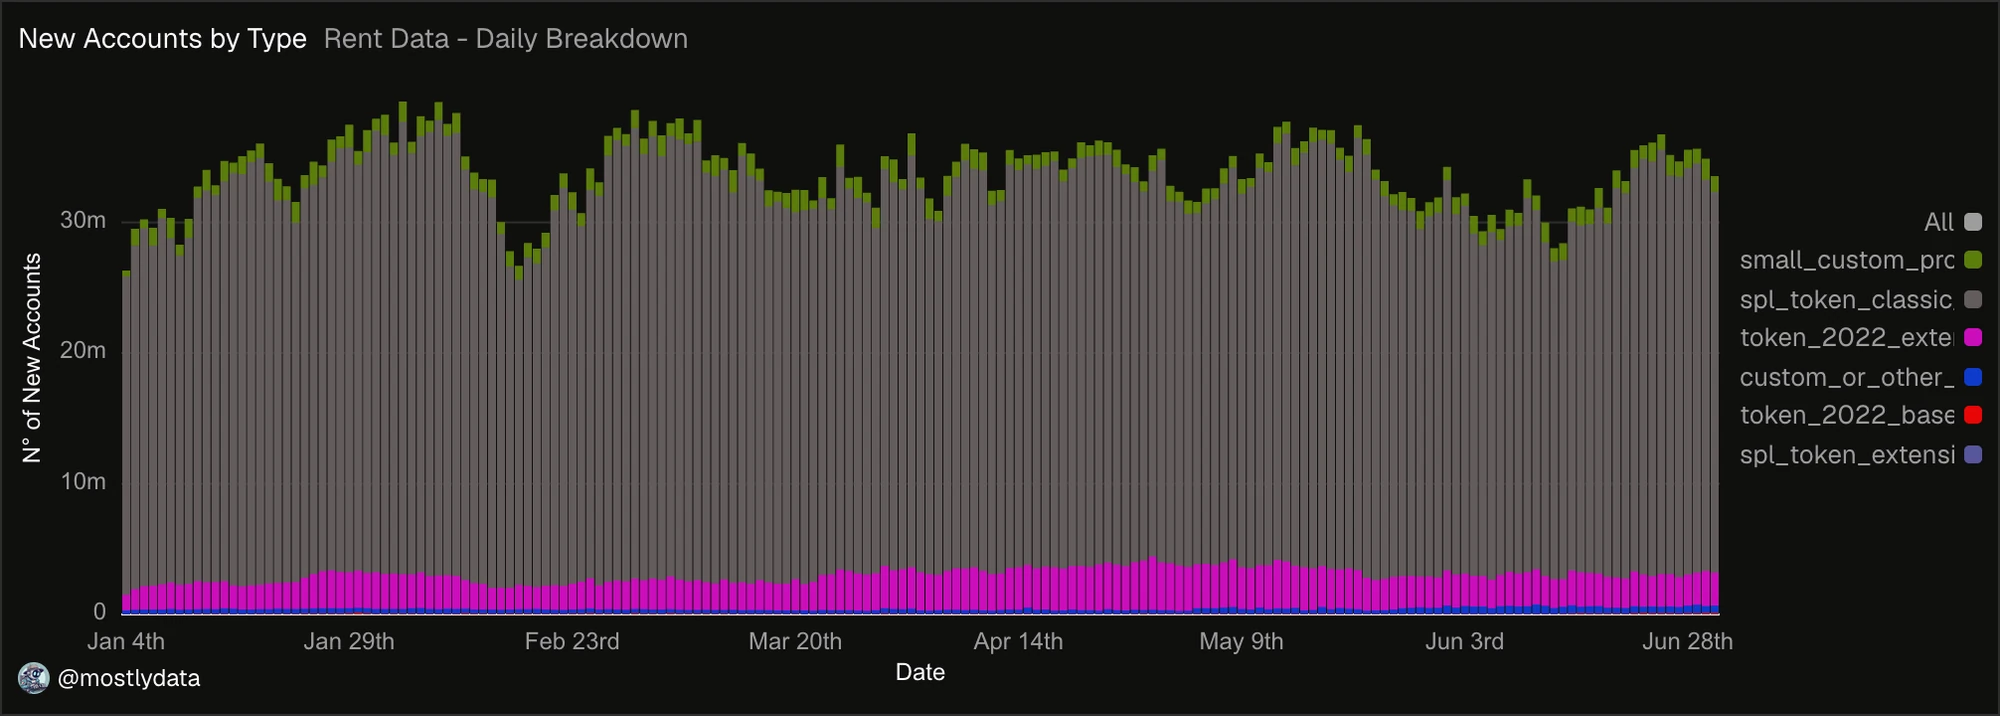
Fig.9: Daily newly created accounts by account type. Counts are not deduplicated by account address. Source: Dune query..
Measuring Account Survival
To estimate persistence, we follow a one-day cohort of non-deduplicated account-creation events from opening to the first observed closure. When an address is recreated, each create–close lifecycle is treated separately.
At each slot horizon , we include only accounts with at least slots of observable history, avoiding the classification of recently created accounts as survivors simply because they have not been observed long enough.
We apply the same calculation to estimated AccountsDB bytes rather than account counts. In the analyzed cohort, 75.5% of creation events close in the same transaction, and only 5.7% of the initially allocated bytes remain after 1 million slots, approximately 4.7 days. Persistence is strongly account-type specific: small custom-program accounts survive longer, but represent only a small share of gross daily state demand.
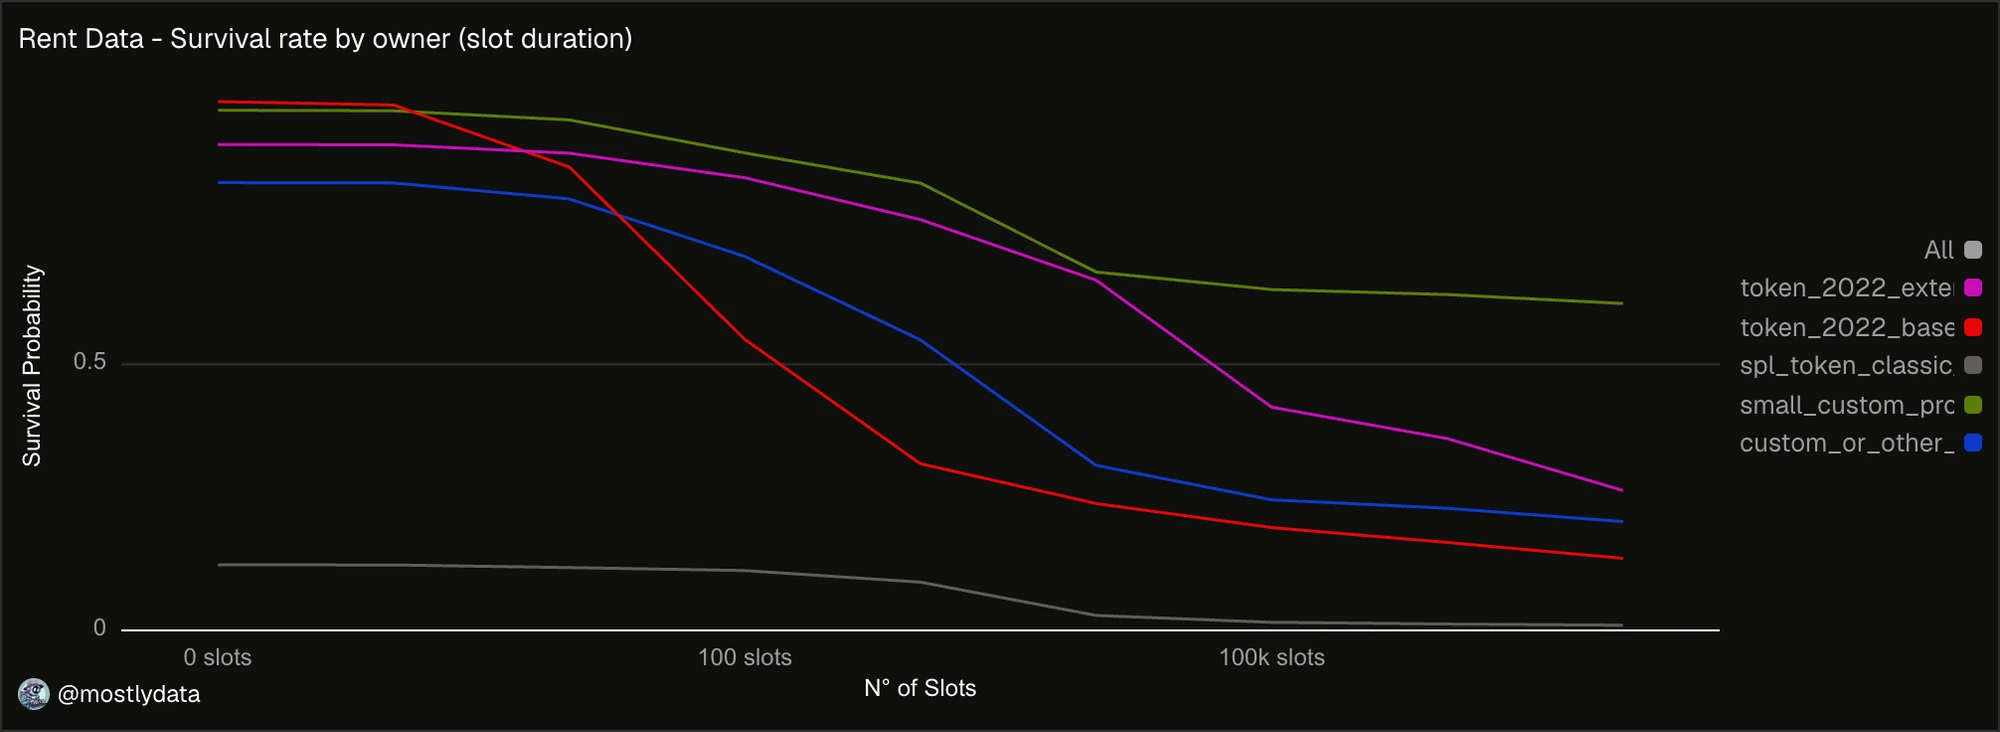
Fig.10: Survival rate for accounts created. Source: Dune query. This doesn’t change based on the day, see here.
The cohort analysis explains why gross allocation rapidly decays, but it is not itself the net-growth calculation. We can measure the net growth from the aggregate live-state balance and also includes closures of accounts created before the analyzed cohort. This results in roughly 1M new account per day (on average), for an estimated space in account DB of roughly 0.3 GB / day.
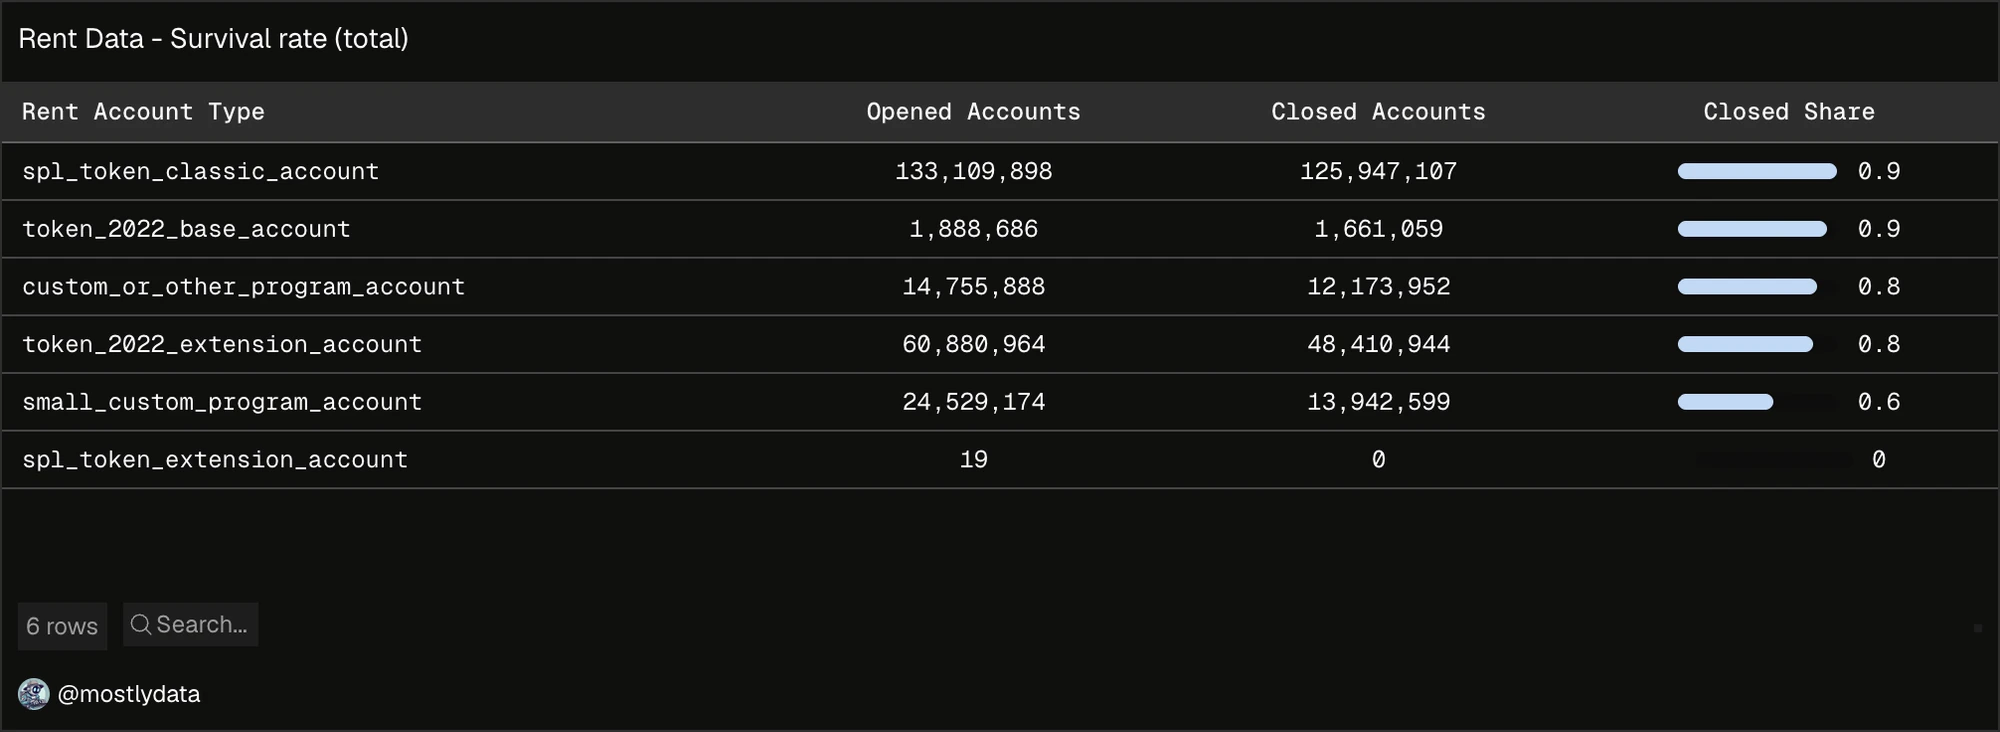
Fig.11: Rate of closed account for accounts created from 1st of June 2026 and 1st of July 2026. Source: Dune query.
How Fast Is AccountsDB Growing?
We fit the recent upward trend in the AccountsDB Storage Files Size metric to estimate the current local growth rate, see Fig.12. Over the selected post-dip period, the fitted growth rate is approximately 0.23 GB a day. This should be interpreted as a local linear estimate rather than a structural long-term forecast. We then extrapolate the AccountsDB storage footprint over a two-year horizon under different multiples of the current fitted growth rate.
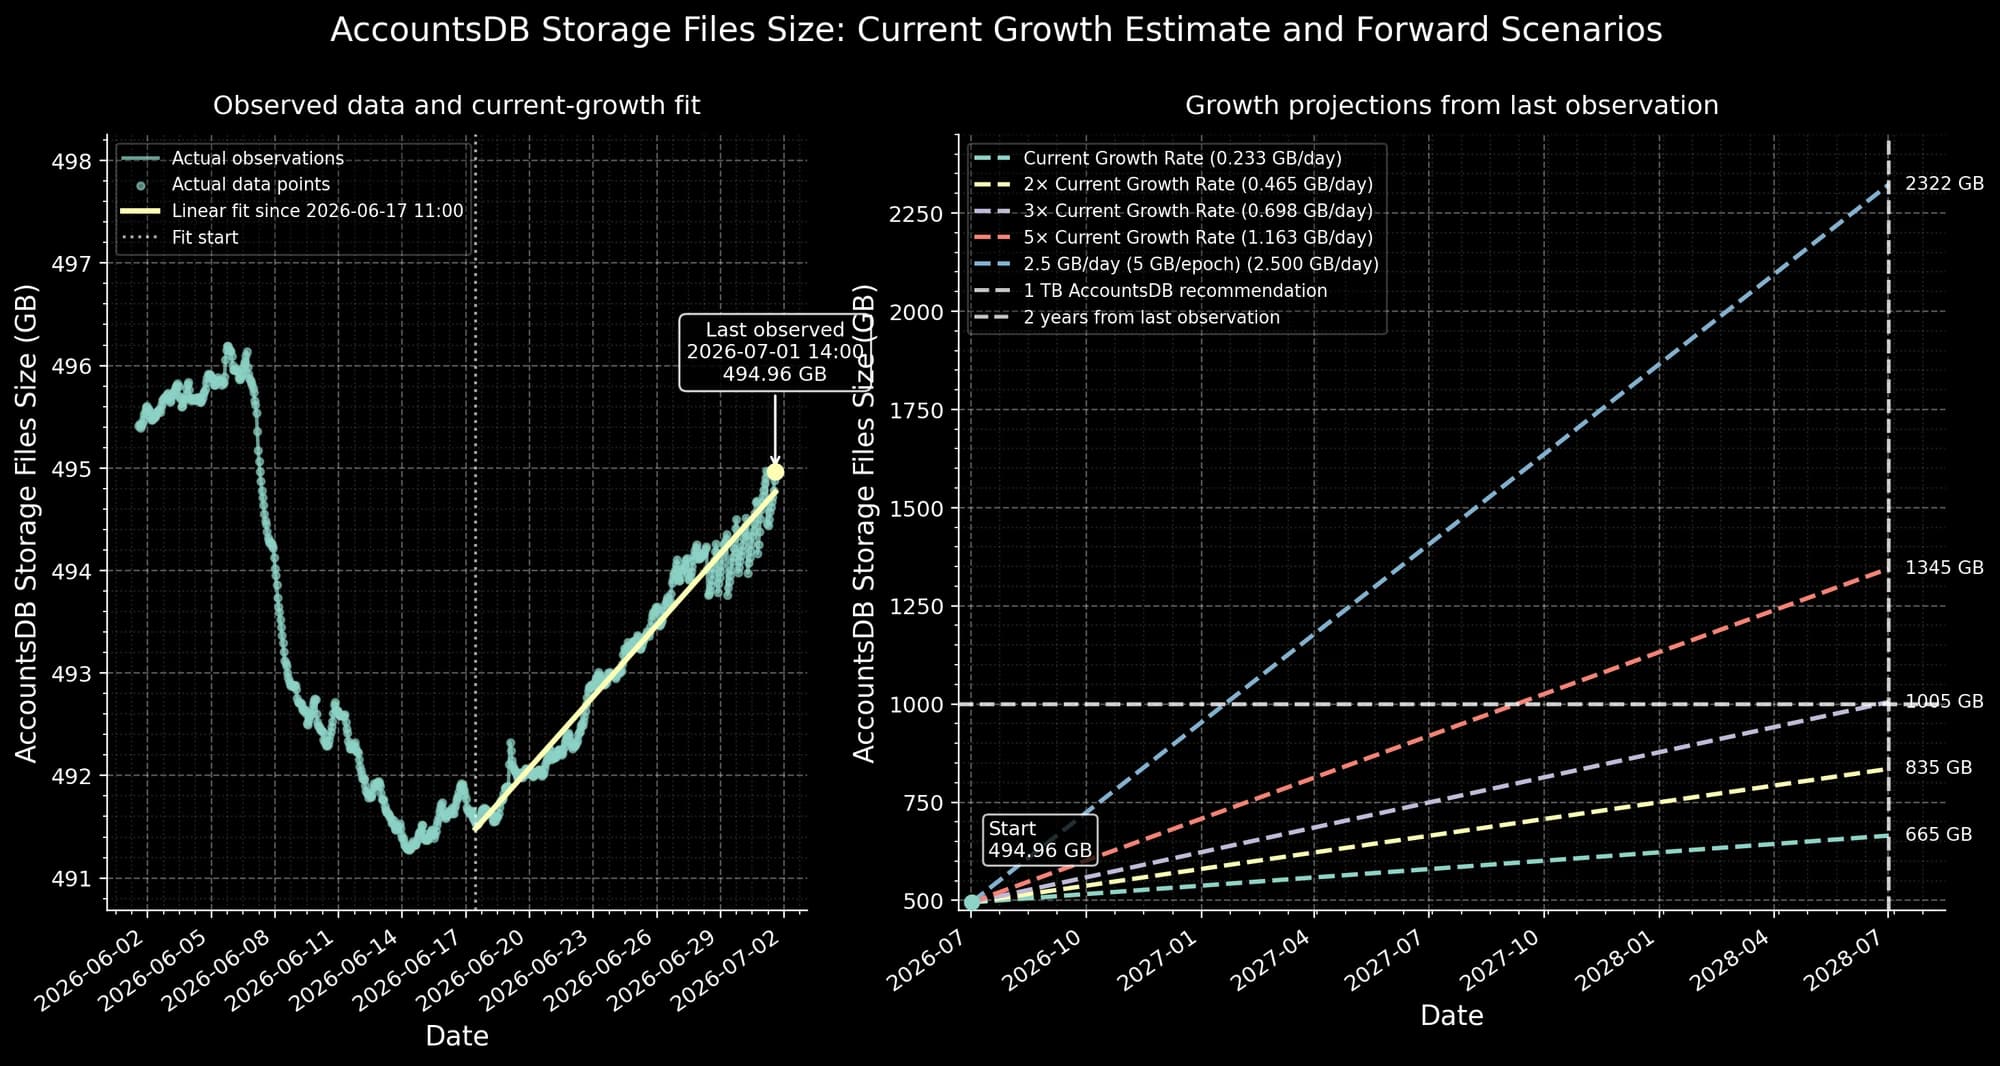
Fig.12: Left Panel: Fit of the current growth rate of AccountsDB size, taking only the rapidly growing case. Right Panel: Forecasted AccountsDB size over time under different growth rate.
This estimate is not directly interchangeable with the previous 0.3GB/day. The approximately 0.3 GB/day figure is reconstructed from account creation and closure flows, whereas the 0.23 GB/day estimate is a local fit to physical AccountsDB storage files over a selected post-dip window. Differences may reflect the observation period, storage cleanup and shrink behaviour, and the distinction between logical live state and physical file allocation.
Under the baseline growth rate, AccountsDB storage would reach approximately 665 GB after two years. At 2x the current growth rate, it would reach roughly 835 GB; at 3x, approximately 1.0 TB; at 5x, approximately 1.35 TB; and under a deliberately aggressive 10x scenario, approximately 2.3 TB.
This means that even a growth rate substantially above the current observed trend would remain within a few terabytes over a two-year horizon.
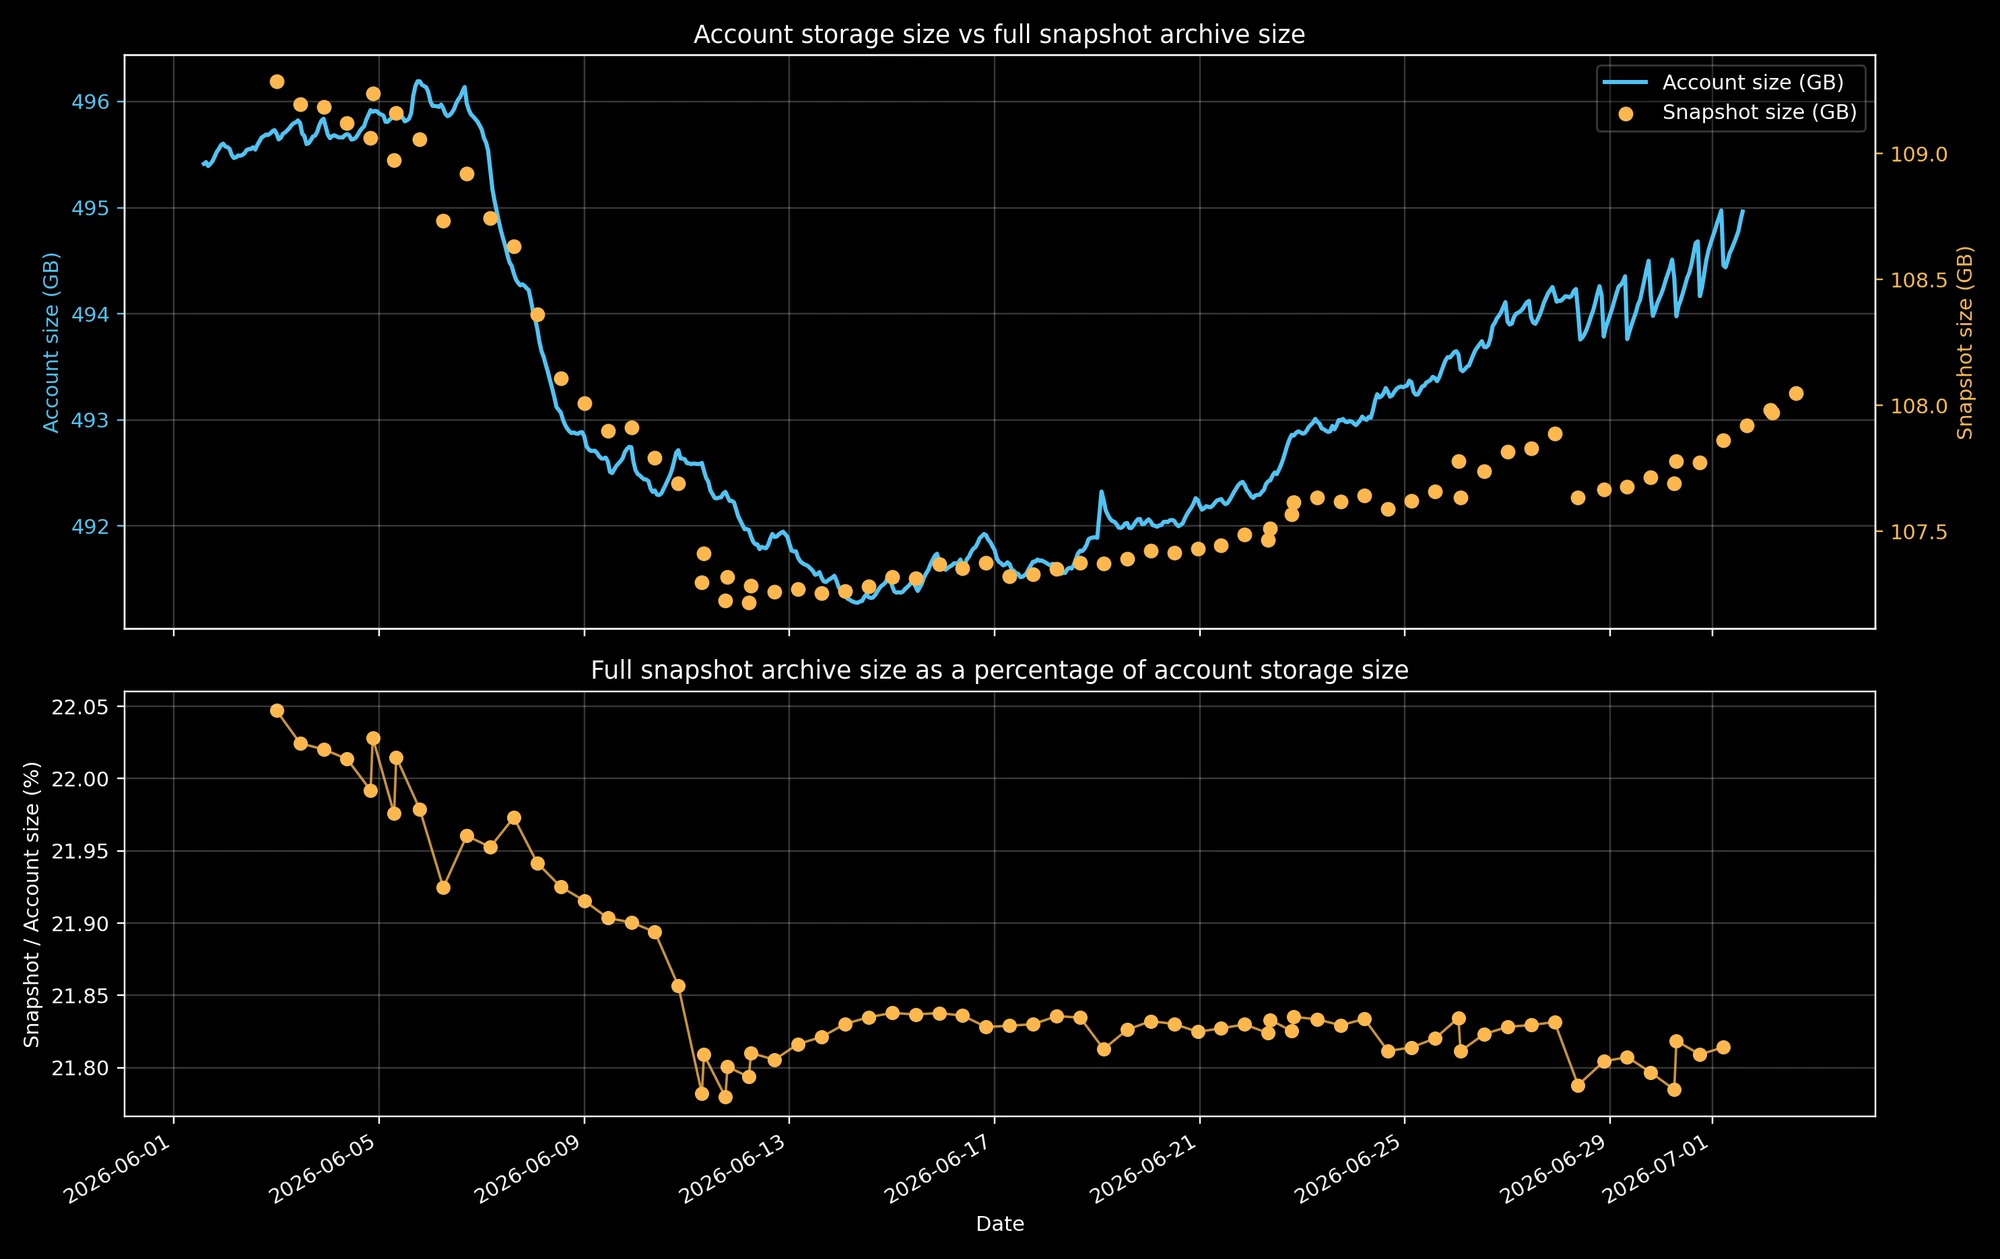
Fig.13: Account size and snapshot size.
Compressed full snapshot archives are significantly smaller than the uncompressed AccountsDB storage files. In the observed data, the full snapshot archive size is approximately 22% of the AccountsDB Storage Files Size.
Applying this ratio to the most aggressive scenario shown above gives roughly ~460-510 GB. This suggests that compression materially limits snapshot growth, but it does not establish that 500 GB is sufficient for an operational snapshot volume once retention, incremental archives, temporary files, and safety headroom are included.
What Occupies Solana State Today?
Live Solana state is concentrated in a few storage-heavy categories: SPL Token accounts are the single largest component, OpenBook/Serum remains one of the largest persistent DeFi state clusters, and NFT infrastructure still occupies a substantial share of live bytes.
Figure 14 highlights an important difference between account count and state footprint. In particular, OpenBook/Serum accounts represent only a very small share of all accounts, yet they occupy roughly 30% of the live state in the snapshot. This strongly suggests that the main driver is not simply adoption, but bytes per account. That interpretation is consistent with the protocol design: a Serum/OpenBook market is not a single compact pool account, but a heavier state object requiring separate persistent accounts for the market itself, request queue, event queue, bids, and asks, with trading activity also relying on OpenOrders accounts. In other words, the orderbook architecture stores substantial market structure directly on chain.
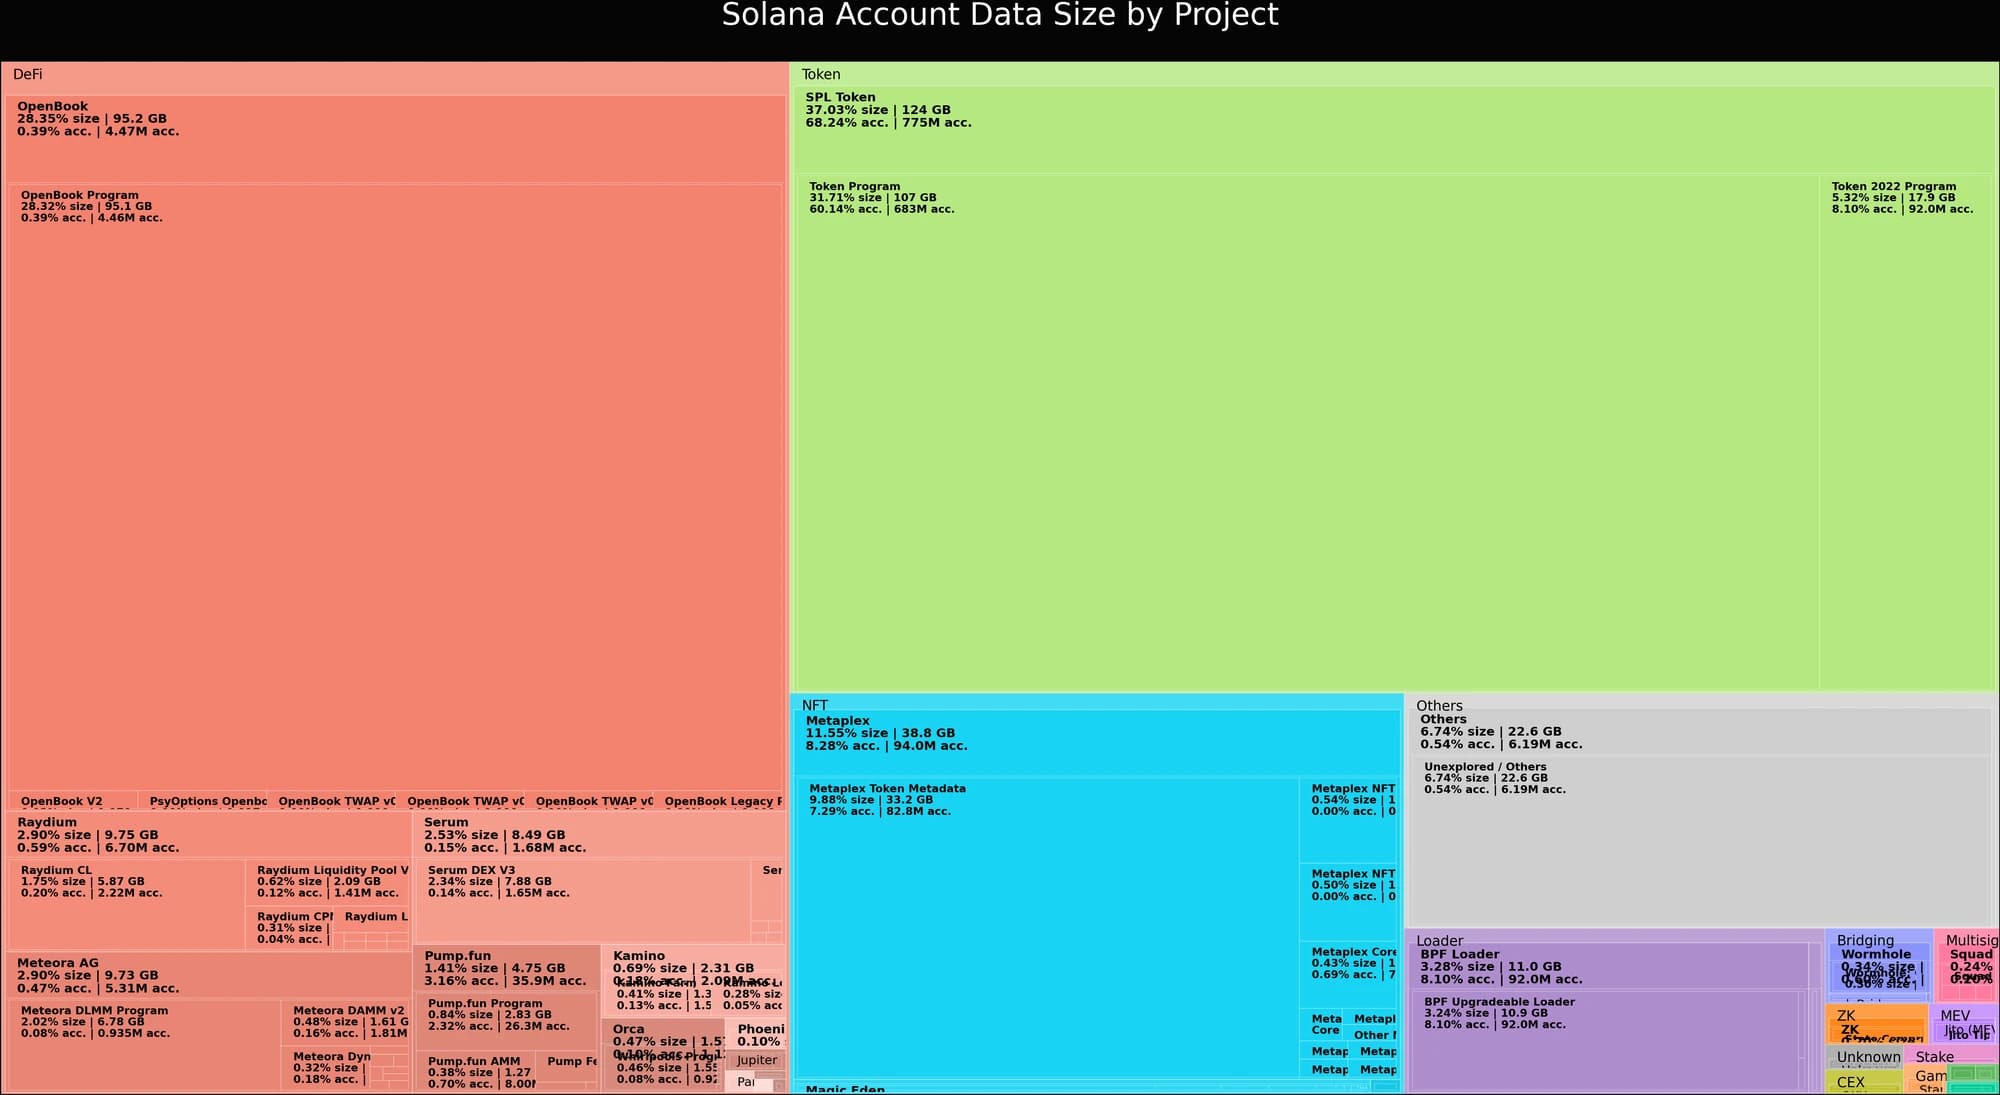
Fig.14: Solana Account Data Size Snapshot at epoch 997.
The second major result is that SPL Token is the largest state category in the current snapshot. This is not surprising, since token accounts are the basic storage primitive used across wallets, DeFi, airdrops, launchpads, and token issuance more broadly. A notable share of this token-state footprint appears to be related to Pump.fun-style assets: using a suffix-based heuristic, roughly 30% of SPL-Token space appears associated with Pump.fun-related tokens. This attribution should be treated cautiously, however, because naming-based identification is imperfect and any issuer can generate a token with a similar suffix. The interpretation is therefore indicative rather than definitive: the result is best read as evidence that the memecoin issuance ecosystem is a meaningful contributor to live token-account state, not as an exact measurement of Pump.fun’s unique footprint.
Finally, the snapshot shows that the NFT stack remains a significant source of persistent storage. Most of this footprint appears to come from Metaplex Token Metadata, which is consistent with the fact that NFT ecosystems require more than token balances alone: they also maintain metadata, collection structure, and related indexing objects. This makes NFTs structurally more storage-intensive than simple fungible-token balances, even when transactional activity is lower than in DeFi or token-launch workflows.
What Lower Rent Would Change for Payments
A reduction in the rent-exempt requirement would reduce the SOL required to initialize new accounts by 90%. For account-heavy applications, this would materially lower the capital needed to onboard users and maintain persistent state. For payment flows, the cost of creating a standard SPL token account would move from roughly $0.16 to $0.016 at the SOL price used in this analysis. This will have huge implications on segments like payments.
On Solana, a wallet does not hold SPL tokens directly. It normally uses a deterministic Associated Token Account for each token mint. If the recipient does not yet have the appropriate account, the sender can create it in the same transaction as the transfer, but must also fund its rent-exempt balance. Once that account exists, subsequent payments in the same token do not require creating it again. Account creation is therefore primarily a one-time onboarding cost per wallet and mint, rather than a cost paid on every payment.
At the sample SOL price of approximately $77.94, the current rent deposit for a standard SPL token account is:
With a reduction it becomes $0.0159.
This has a huge implication on segments like payments. If we compare the reduced distribution of rent with Tempo, a payments-first Layer 1 purpose-built for stablecoin payments, we see how Solana places costs for account creation in the lower tail of Tempo’s observed account-creation costs, see Fig.15. Despite Tempo provides stablecoin-denominated gas fees and dedicated payment blockspace, explicitly targeting predictable payment costs without requiring users to hold a volatile gas asset, we can also see how Solana will result in a much more stable cost, showing a reduced volatility.
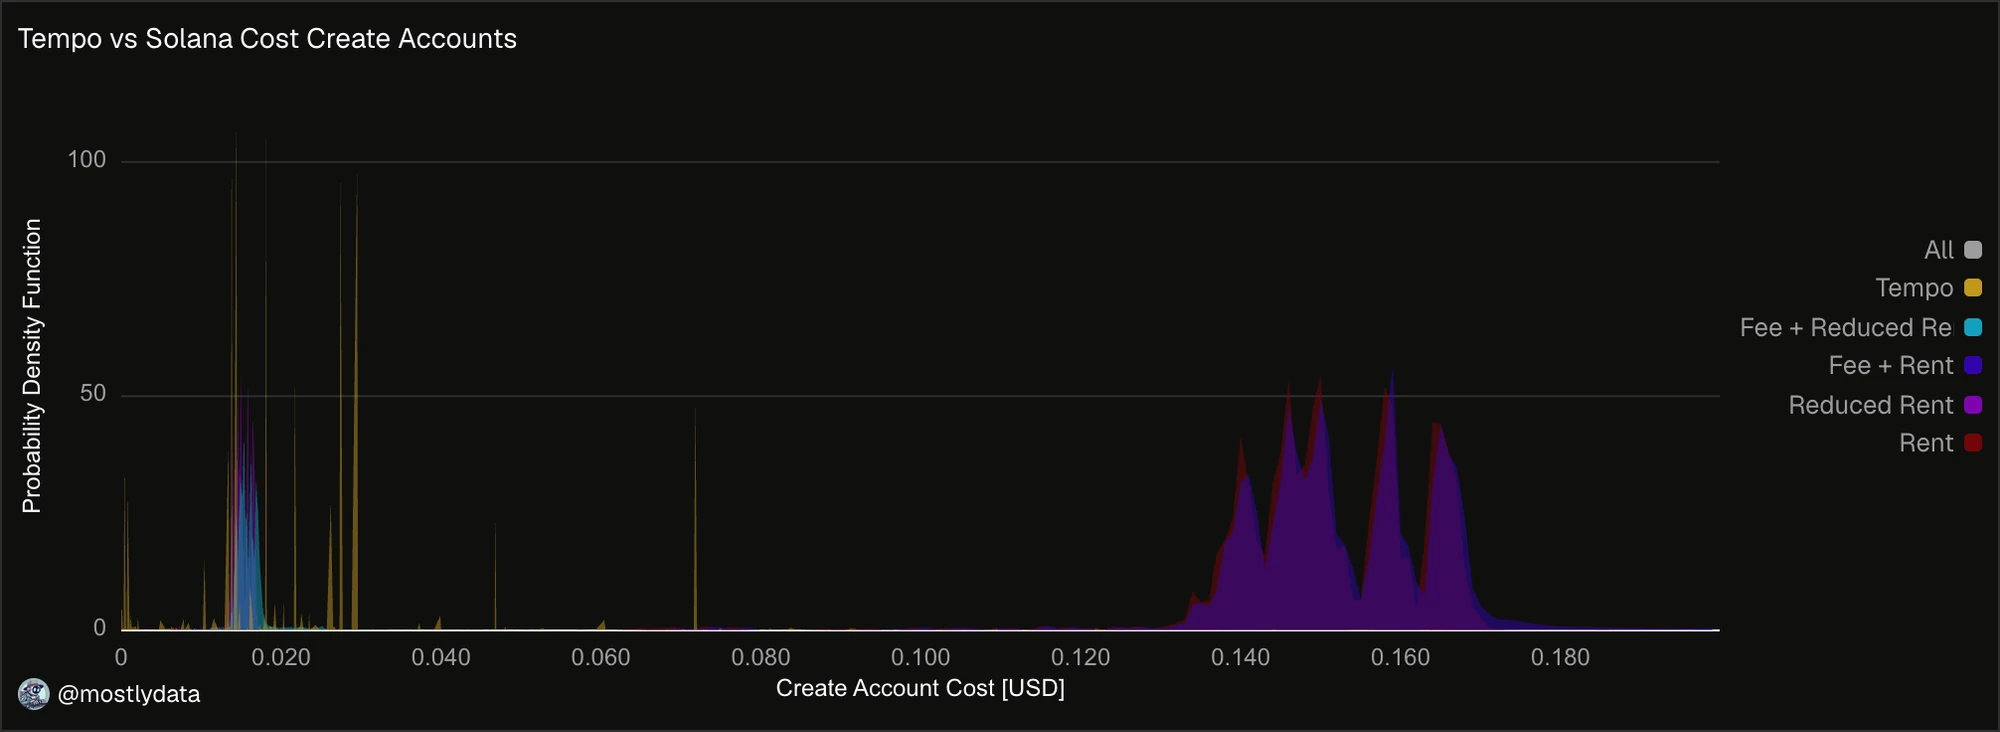
Fig.15: Distribution of account-creation costs on Tempo and Solana under the current and 10×-reduced rent schedules. Solana values combine transaction fees with the rent-exempt deposit; the latter is recoverable when the account is closed, whereas Tempo gas represents an execution expense. Source on Dune.