
Slot Time Reduction Effects
Relevant Charts
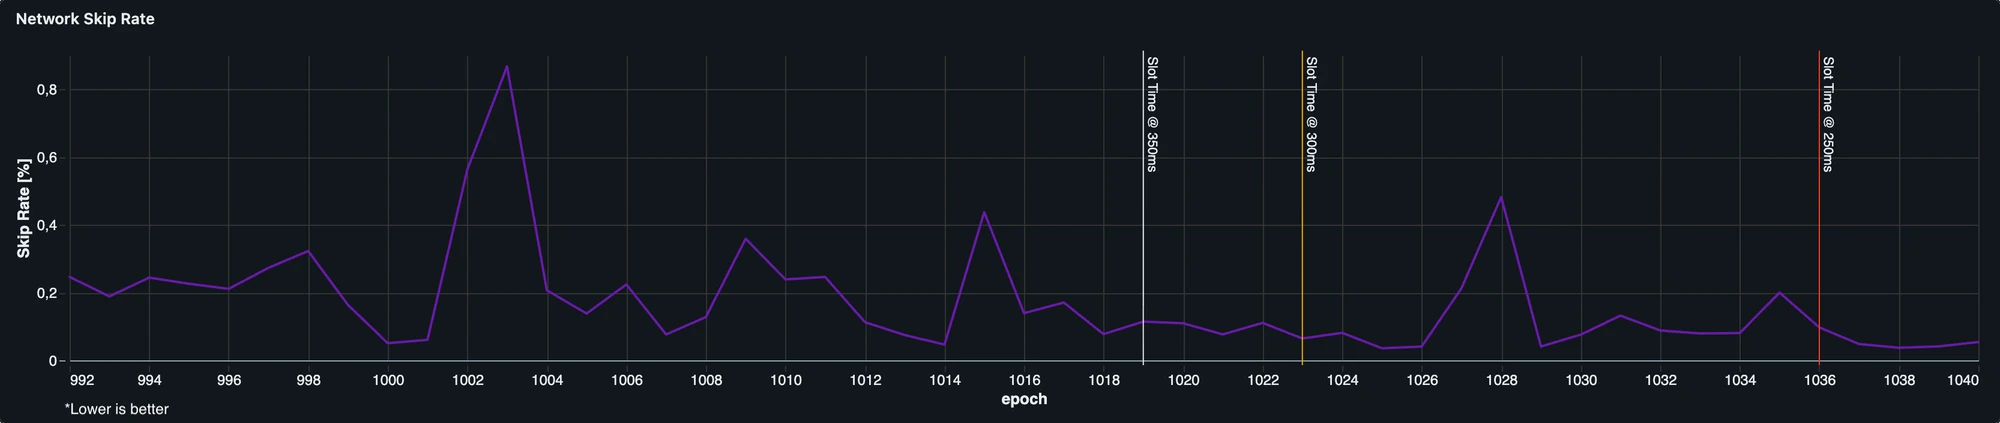
Solana skip rate over epochs. Vertical lines represent the passage between one slot target to the other. Previous to target @ 350ms, Solana was targeting 400ms slot time. Skip rate remains stable and low.
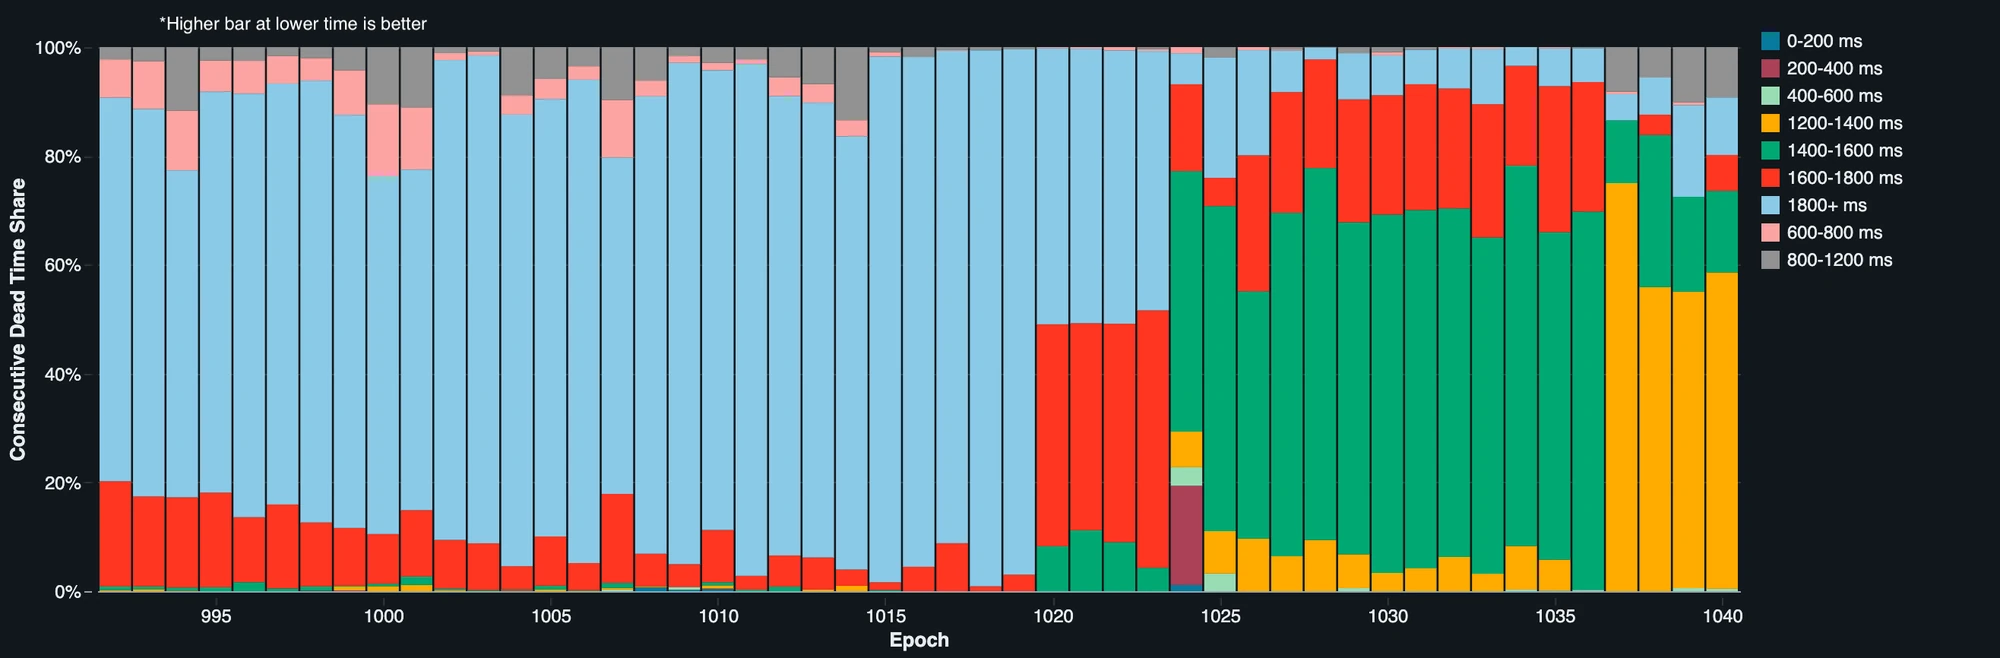
Epoch evolution of the consecutive dead time share due to skipped slots. Solana has now less consecutive dead time.
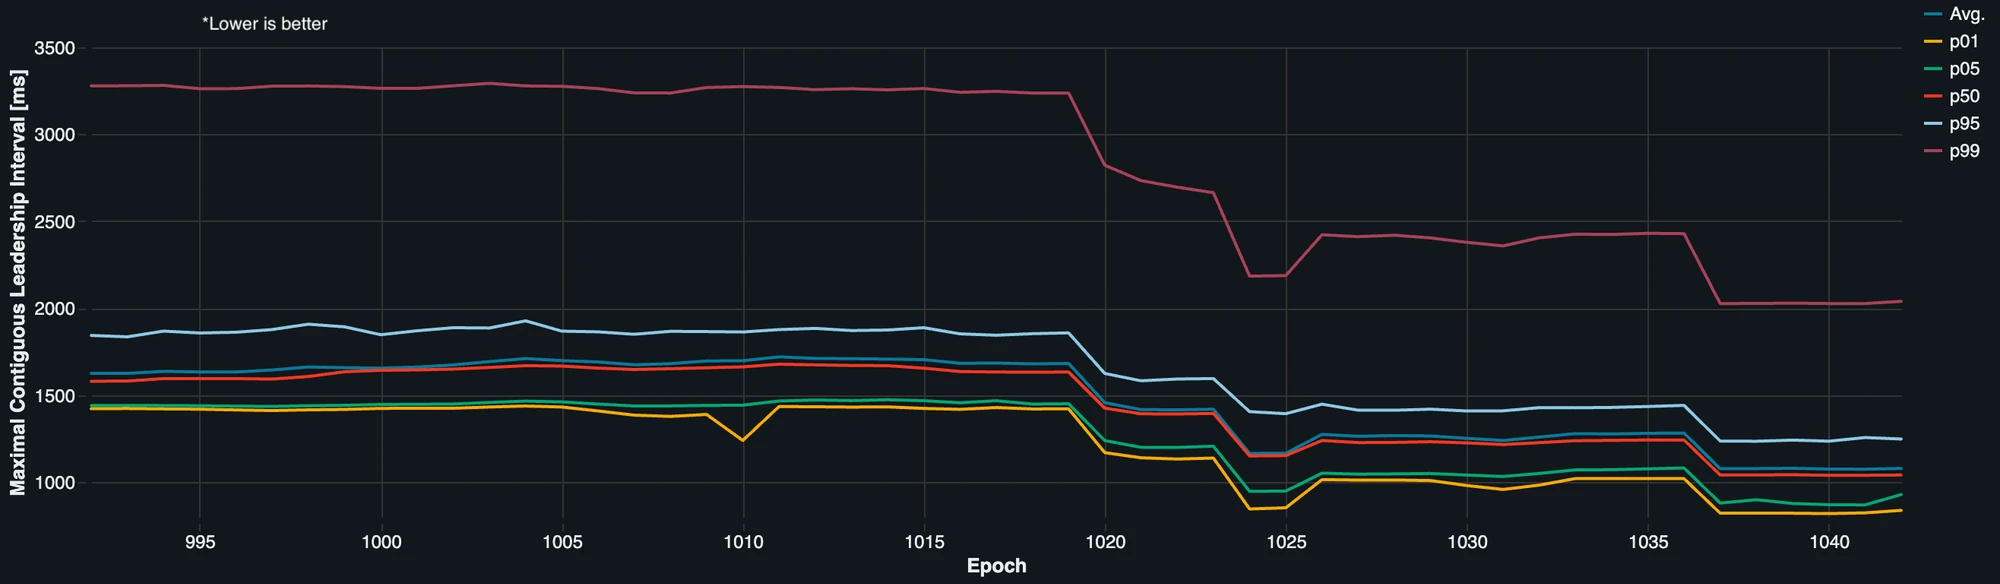
Evolution over epochs of the maximal contiguous leadership interval in ms. Blue line is the average, yellow line is the p01, green line is the p05, red line is the median, light blue line is the p95, and purple line is the p99 of the distributions. p99 drops from ~3s to ~2s, representing substantial reduction in the time window available for extractable value.
TL;DR
- Skip rate remains stable and low. It results uncorrelated from slot time reduction
- Solana slot production pipeline remains safe
- A consequence of a stable skip rate under a lower slot time target is that the consecutive dead time due to skips shrinks
- Vote latency increased, with nodes in Asia and South America being the most affected
- This suggests caution when thinking about a 200ms target pre-Alpenglow
- Probability of credit loss decreased
- Validators with more stake lose proportionally fewer credits compared with low staked validators
- We see a substantial reduction in the time window available for a single leader to extract value from users
- Lower slot time reduces duration of single-leader control over transactions ordering
- Overall, the observed effects point to a solid engineering framework
- The remaining discussion around a 200 ms target is therefore increasingly philosophical and economic, rather than purely technical.
Introduction
Block 440,208,000 (or Epoch 1,019) marked a major milestone for Solana; after 6 years, including roughly one year at constant 400ms, the network began a substantial reduction towards 200ms slot time.
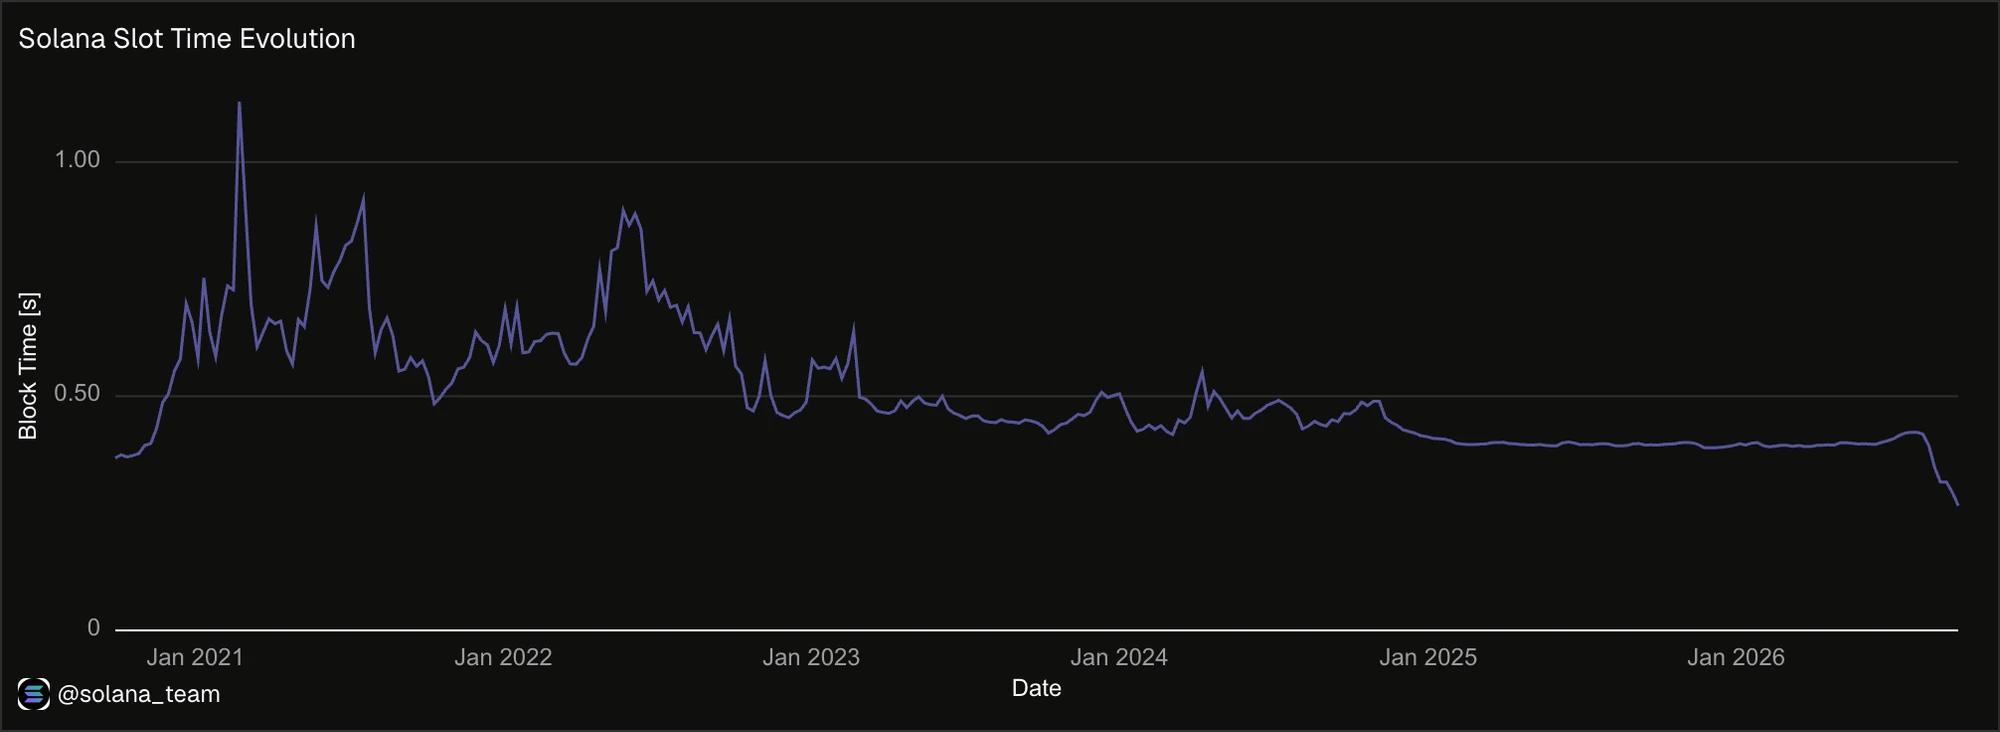
This is not about showcasing a vanity metric. It is about taking advantage of Solana’s improved performance. Geographic distribution and PoH have historically made lower slot times challenging, but the network has now reached a point where the potential gains justify testing those limits.
Solana is here to compete on performance, and doing so requires continuously exploring the boundaries of what the network can sustain.
However, pushing those boundaries also requires understanding the consequences.
In this article, we examine several effects already visible on-chain following the reduction in slot time, and what they may imply as Solana continues moving toward lower targets.
Skip Rate
One of the key metric to take under control is the skip rate.
Leader schedule fixes in advance which validator should produce a slot. It can happen that a scheduled leader does not successfully contribute to the final history, mostly for two reasons. A leader can be offline when it comes to building its blocks, or the proposed block belongs to a fork later abandoned by consensus.
Lowering slot time can only affect the latter. Indeed, leaders being offline is primarily an operational issue, rather than an effect of shorter slot times. On the contrast, lowering slot time reduces the time a leader has to produce a block; it consequently reduces how long subsequent leaders wait before treating that slot as missed.
Fig.1: Solana skip rate over epochs. Vertical lines represent the passage between one slot target to the other. Previous to target @ 350ms, Solana was targeting 400ms slot time.
Figure 1 shows that during the slot time reduction, skip rate remained stable. This indicates that validators are still able to keep up with network speed.
Of course, there are some regions that are suffering more. Indeed, skip rate is more concentrated when leader’s handoffs happen in some geographical configuration.
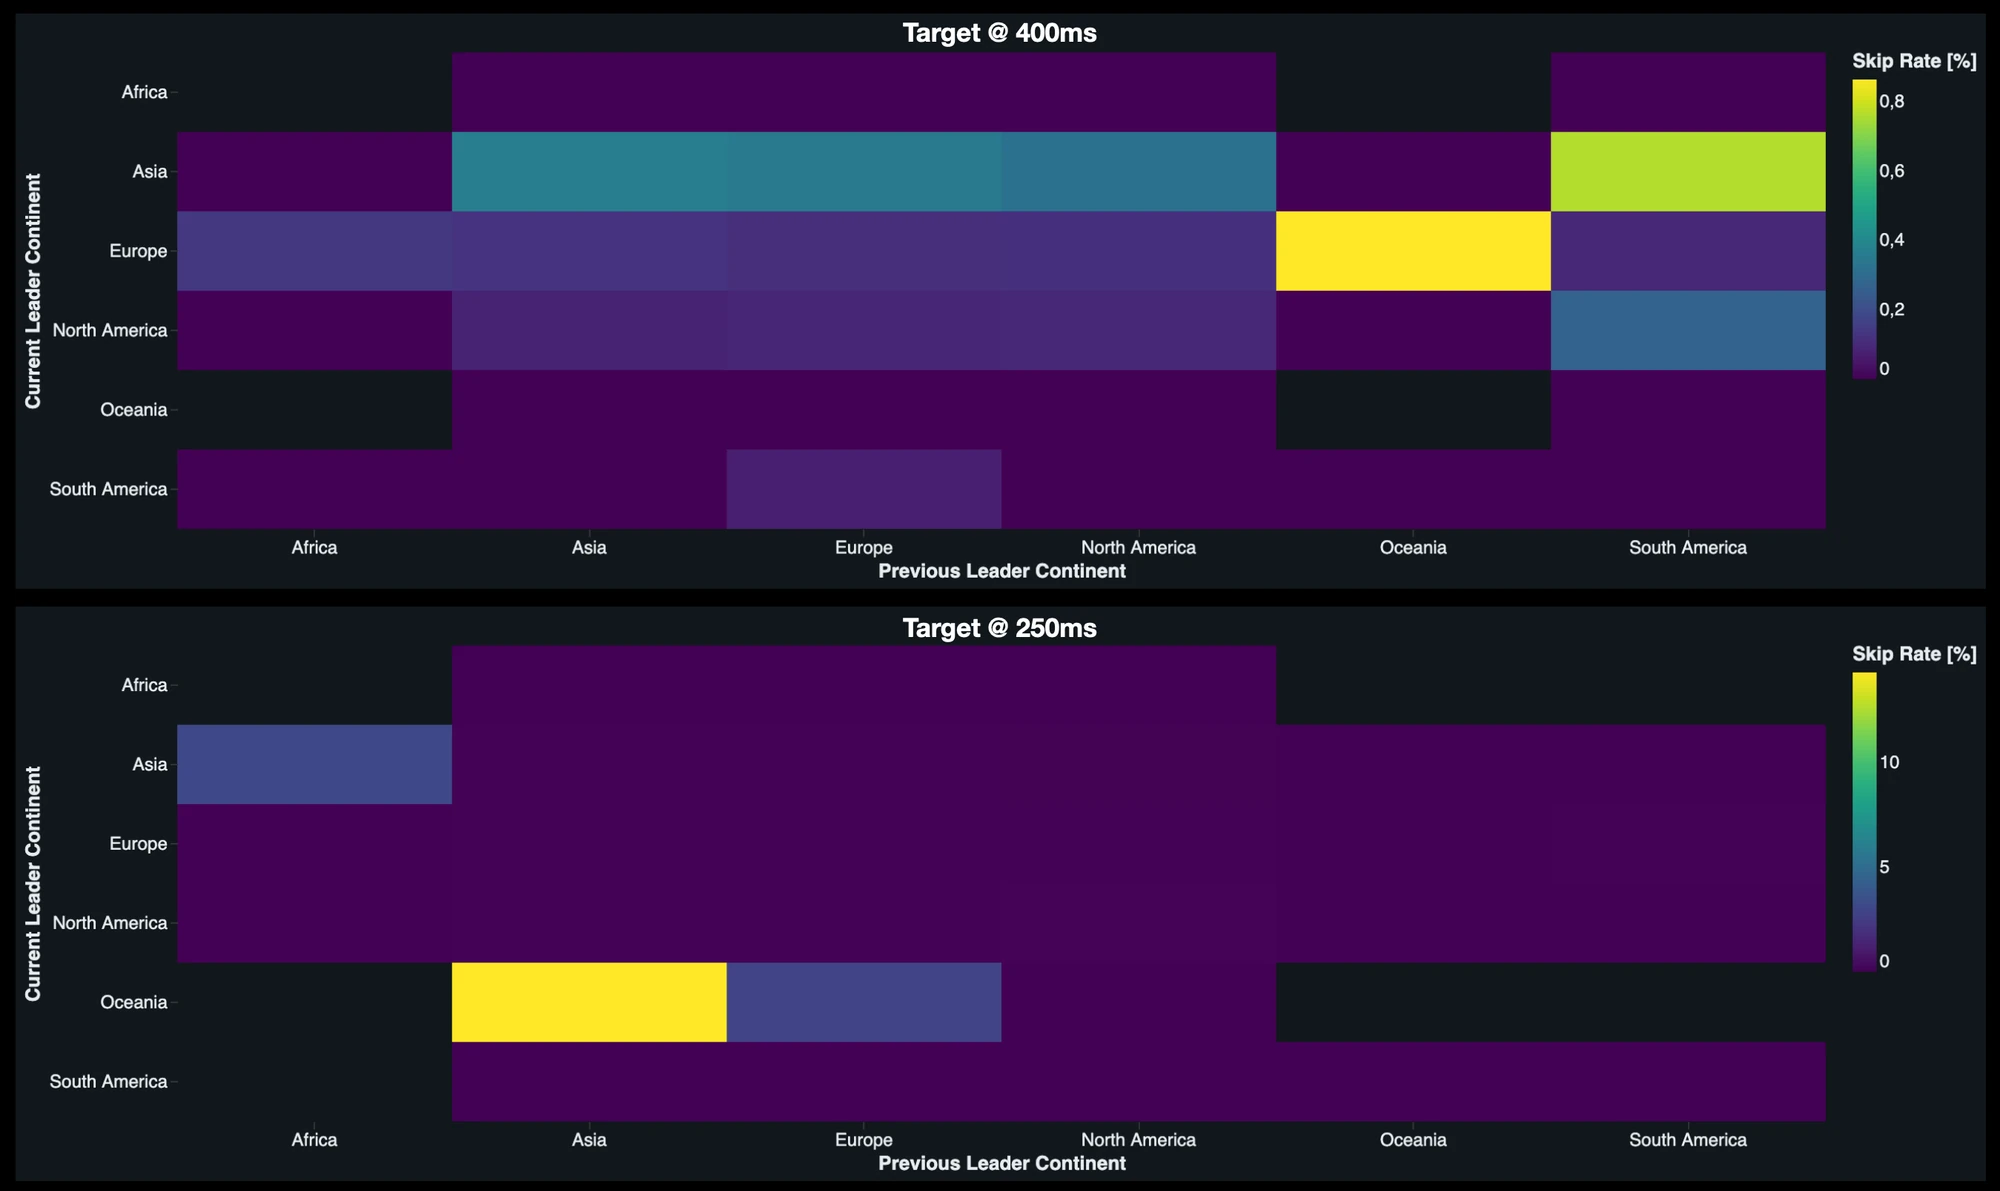
Fig. 2: Skip rate by leader handoffs divided by continent shift. Top panel is measured with a slot target of 400ms, bottom panel is measured with slot target of 250ms.
Figure 2 shows that the “critical” handoffs are Asia→Oceania and Europe→Oceania. It is worth mentioning that, the 250ms target is in place only for a small number of epochs. This makes the sample size for these region with low stake small:
- Asia→Oceania has 7 observation
- Europe→Oceania has 35 observations.
Thus, we are not able to assess the nature of the skip and reject the hypothesis it’s just a statistical fluke.
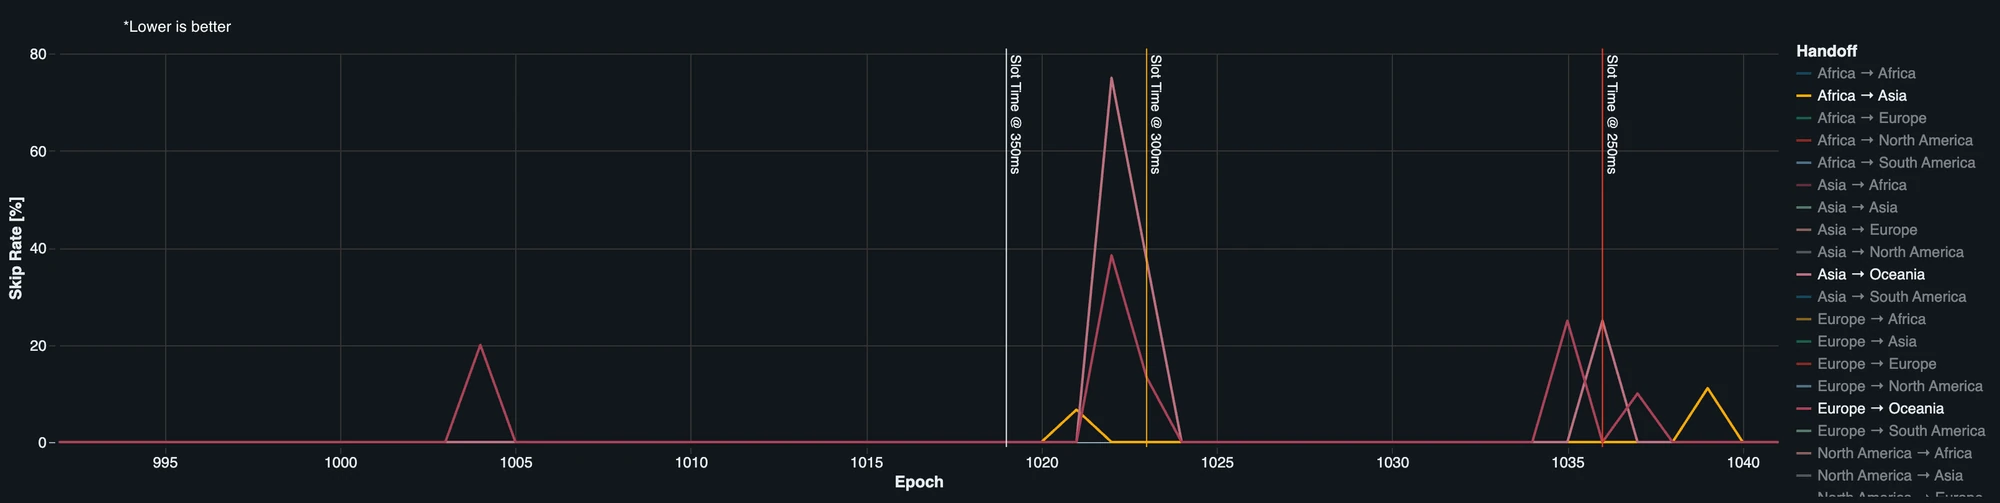
Fig. 3: Skip rate evolution by epoch dividing by geographical leader handoffs.
Indeed, by focussing on the per epoch evolution of the skip rate by geographical handoff, we see that there is no dramatical shift in skip behaviour after 250ms slot time activation, see Fig. 3.
Of course, at Solana Foundation, we closely monitor these metrics and we will pay particular attention to this geographical connection.
Solana Consecutive Dead Time
One consequence of observing a stable skip rate while lowering the slot time target is that the consecutive dead time due to skips shrinks, see Fig. 4.
Consecutive dead time is defined as the continuous period during which Solana produces no new canonical block because multiple consecutive slots are skipped. It ends when a subsequent slot successfully lands on the canonical chain.
Fig. 4: Epoch evolution of the consecutive dead time share due to skipped slots.
As a consequence, periods during which Solana does not advance become shorter. Precisely, Solana moved from more than 1800ms of consecutive dead time being the dominant component, to ranging between 1200ms and 1400ms.
A Note on Vote Transactions
Of course, reducing slot time introduces an unwanted behaviour: higher vote latency.
Looking at the evolution of vote latency over time, a clear trend is made visible across activation of successive slot time reduction feature, see Fig. 5.
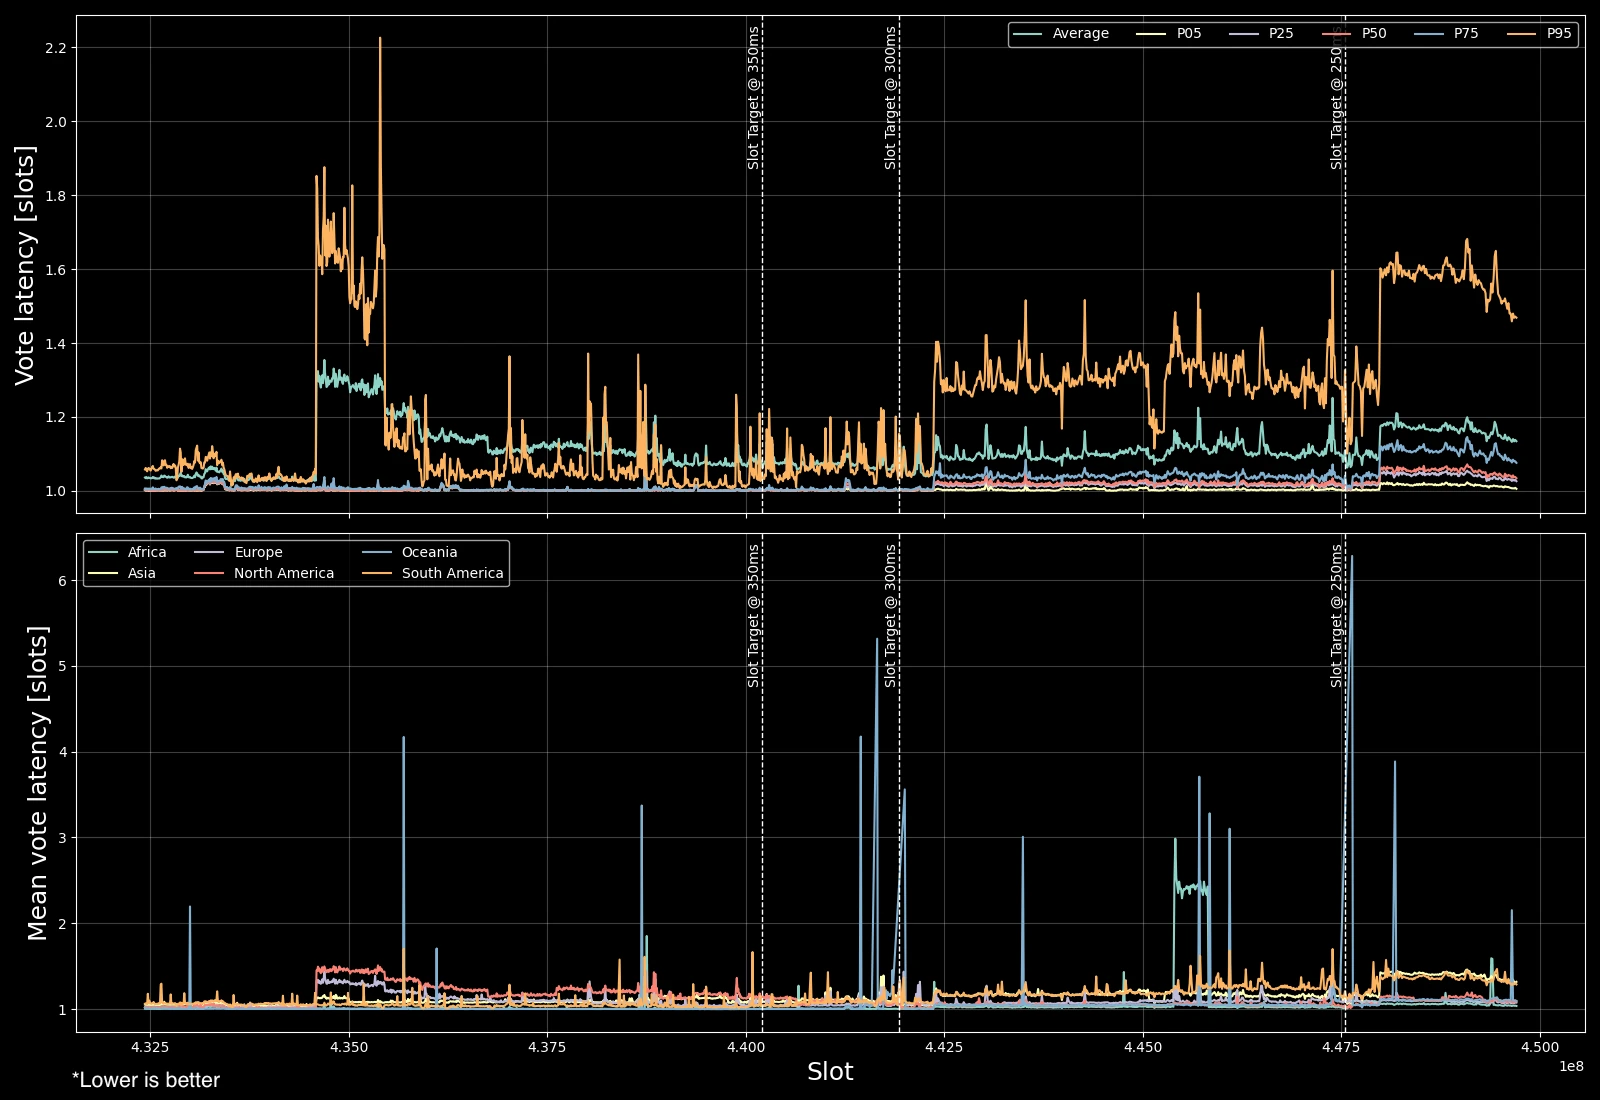
Fig. 5: Evolution of vote latency, measured in slots. Top panel is whole network. Bottom panel is divided by geolocations.
This is particularly augmented when breaking down by geolocations, with Asia and South America suffering the most.
This is a direct consequence of the fact that votes are transactions, that need to land on-chain. This will radically change under Alpenglow, where votes are direct messages between validators and proof of voting is collected within 8 slots.
It is worth mentioning that, the observed increase in vote latency has no tangible effects on consensus. The network average is well below 2 slots, meaning that there is no evidence for consensus instability; network average behaviour is still voting for slot N into slot N+1.
Average vote latency alone does not capture the impact on individual validators. For that, we need to look at vote credits, which determine validators’ voting rewards and decrease when votes land too late. They therefore show whether higher vote latency translates into an actual economic penalty.
Looking at vote credits, the overall probability of losing credits decreased, see Fig. 6.
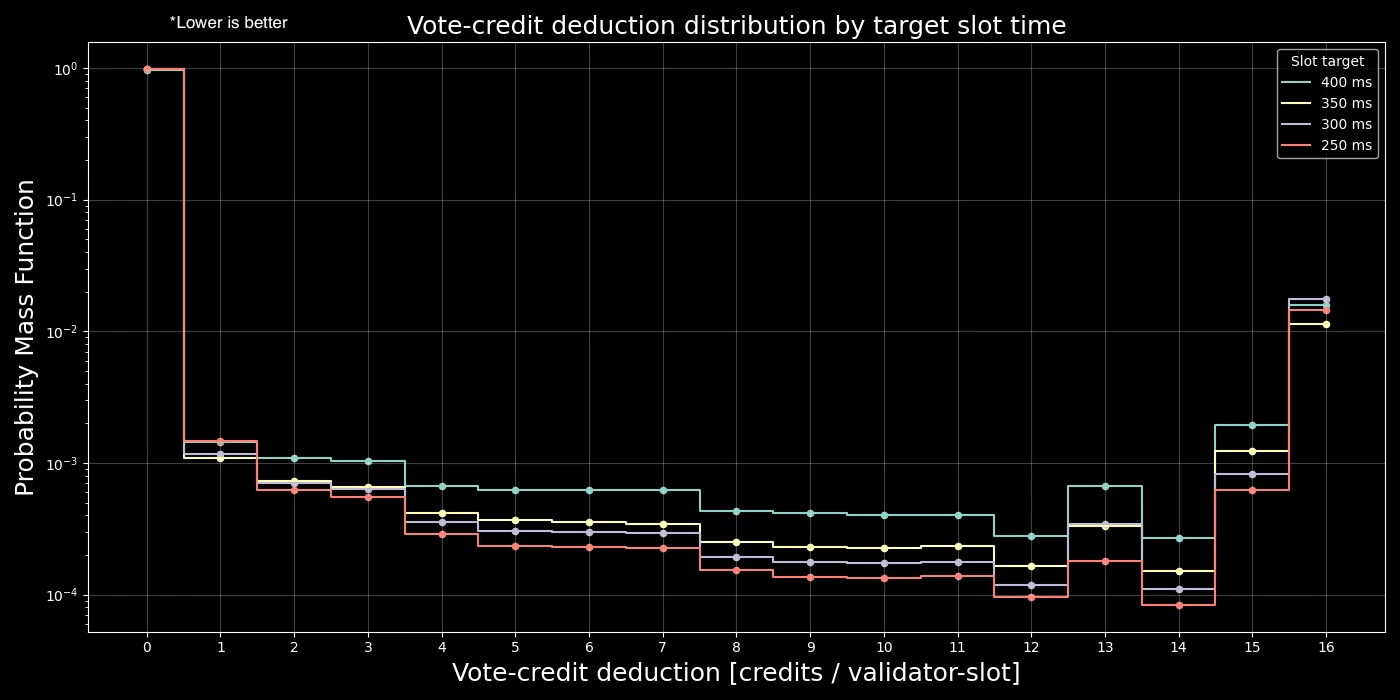
Fig. 6: Probability mass function of vote credit deduction divided by target slot time.
The fraction of credits lost does not evolve linearly and may depend on several network conditions.
Moreover, comparing stake-weighted and unweighted losses reveals a clear difference. Validators with more stake lose proportionally fewer credits than the validator population when each validator is weighted equally.
| Target | Lost fraction unweighted | Lost fraction stake-weighted |
|---|---|---|
| 400 ms | 2.1053% | 0.2622% |
| 350 ms | 1.4361% | 0.1612% |
| 300 ms | 2.0061% | 0.2327% |
| 250 ms | 1.6360% | 0.0874% |
Maximal Contiguous Leadership Interval
Lowering slot time reduce also the maximal contiguous time a validator can exercise its leadership power.
This reduces the set of possible strategies a malicious validator can run to extract value from users.
Fig. 7: Evolution over epochs of the maximal contiguous leadership interval in ms. Blue line is the average, yellow line is the p01, green line is the p05, red line is the median, light blue line is the p95, and purple line is the p99 of the distributions.
As we can see, the p99 dropped from ~3s to ~2 s, representing a substantial reduction in the time window available for extractable value.