Microscope is self-hosted monitoring and alerting for Solana programs, open source under MIT. It watches every instruction your program runs and every event it emits, along with the Squads multisig that controls it, and alerts your team on Slack, Telegram or PagerDuty when something you care about happens. Point it at your program and its IDL, and one config file sets up the dashboards and alert rules.
Your programdecoded from its IDL
Squads multisigoptional · v3, v4 or v5
Slack
Telegram
PagerDuty
How to start
Clone, pick a setup, write the config, then deploy.
Clone the repo
git clone https://github.com/solana-foundation/solana-microscope.git
cd solana-microscopeChoose your setup
Microscope is five pieces, and your server runs all of them unless you already have your own:
- Indexer
- reads and decodes your program’s transactions
- Alloy
- ships decoded records to Loki
- Prometheus
- stores metrics
- Loki
- stores decoded records
- Grafana
- dashboards and alerts
Each row below is one way to deploy. A filled dot runs on your server; a hollow dot is one you already operate.
| Setup | Indexer | Alloy | Prometheus | Loki | Grafana |
|---|---|---|---|---|---|
| Docker Composeyour machine or one host | |||||
| Terraforma VM in your AWS or GCP account | |||||
| Grafana Cloudyour existing Grafana Cloud stack | |||||
| Kubernetes · referenceyour cluster and observability |
Write the config
Have your AI agent run setup-deployment, a skill that ships with the repo. It asks for each value, derives alert rules from your IDL, writes the files your path needs and validates them.
microscope.toml drives the deployment. Microscope generates the Grafana dashboard, alert rules, contact points and notification policies from it. On the Terraform path, the same blocks go in terraform.tfvars, and Terraform writes this file for you.
program_id = "<PROGRAM_ID>"
idl_path = "idl/idl1.json"[multisig]
vault_address = "<SQUADS_DEFAULT_VAULT>"
state_address = "<SQUADS_STATE_ACCOUNT>"
version = "v4"[datasource]
mode = "rpc"[dashboard]
event_fields = ["name", "signature", "slot", "failed", "data.amount"][alerting]
lookback_window_seconds = 60
evaluation_interval_seconds = 10
explorer_transaction_url = "https://explorer.solana.com/tx/{signature}"[[alerts]]
kind = "event"
name = "payment_settled"
conditions = [
{ field = "data.amount", operator = "gte", value = 1000 },
{ field = "failed", operator = "eq", value = false },
]
severity = "warning"
channels = ["slack"]B, C and D are optional.
AProgram
The program to watch and the IDL to decode it with. The decoder is compiled from that IDL, so run just generate after changing either value. If the config and build disagree, the indexer refuses to start.
BMultisigOptional
The Squads multisig that controls your program. All three values are required together.
vault_address | The default vault shown in the Squads UI |
|---|---|
state_address | Its internal state account: Ms on v3, Multisig on v4, Settings on v5 |
version | v3v4v5 |
Watching the state account covers every vault in the multisig. To alert on one vault, add a condition on the vault index (on v4, data.data.args.vault_index).
CDatasourceOptional
Leave it out to stream from Yellowstone. Set mode = "rpc" to poll your RPC endpoint instead.
DDashboardOptional
These JSON paths set the columns in the event and multisig tables. A missing field shows as an empty cell; the full record stays in Loki. Every record also carries instruction_index, instruction_path and stack_height.
EAlerting defaults
Every alert inherits this timing unless it overrides it. Evaluation intervals must be multiples of 10 seconds. The explorer URL links each notification to its transaction; add ?cluster=devnet for devnet.
FAlerts
Use one [[alerts]] block per rule.
kind | eventinstructionmultisig |
|---|---|
name | An instruction or event declared by your IDL in snake_case, or a Squads action such as proposal_approved. Anything else is rejected at startup. |
match | all any — how conditions combine. Defaults to all. |
conditions | The field is a dot path into the record. Operators: eq, ne, gt, gte, lt, lte, contains, exists. |
severity | criticalerrorwarninginfo |
channels | Slack, Telegram or PagerDuty. Leave empty to evaluate the rule without sending anything. |
After you edit
Run just up again. Grafana reads alert rules at startup, so the command regenerates them and recreates Grafana. A plain docker compose up leaves the running stack on the old rules.
Deploy
cp microscope.toml.example microscope.toml
# add your endpoint and channel credentials to .env
just up
Grafana is on localhost:3000.
cd infra/aws                # or infra/gcp
cp terraform.tfvars.example terraform.tfvars
terraform init              # GCP: add -backend-config for its state bucket
terraform plan
terraform apply
The whole config lives in terraform.tfvars, and Terraform writes microscope.toml. Reach Grafana through the grafana_tunnel output, over AWS SSM or GCP IAP.
# add GRAFANA_CLOUD_* and MICROSCOPE_DEPLOYMENT to .env
docker compose -f docker-compose.yml -f docker-compose.cloud.yml up -d
RPC_URL=<endpoint> ./scripts/export-grafana-cloud.sh <deployment> <folder-uid>
Only the indexer and Alloy run. Import the exported dashboard and alert rules into your stack. Terraform can also target Grafana Cloud by setting grafana_cloud.
Running Kubernetes? The reference manifests run the indexer next to observability you already operate.
What you’ll see
An example of the dashboard Microscope generates.




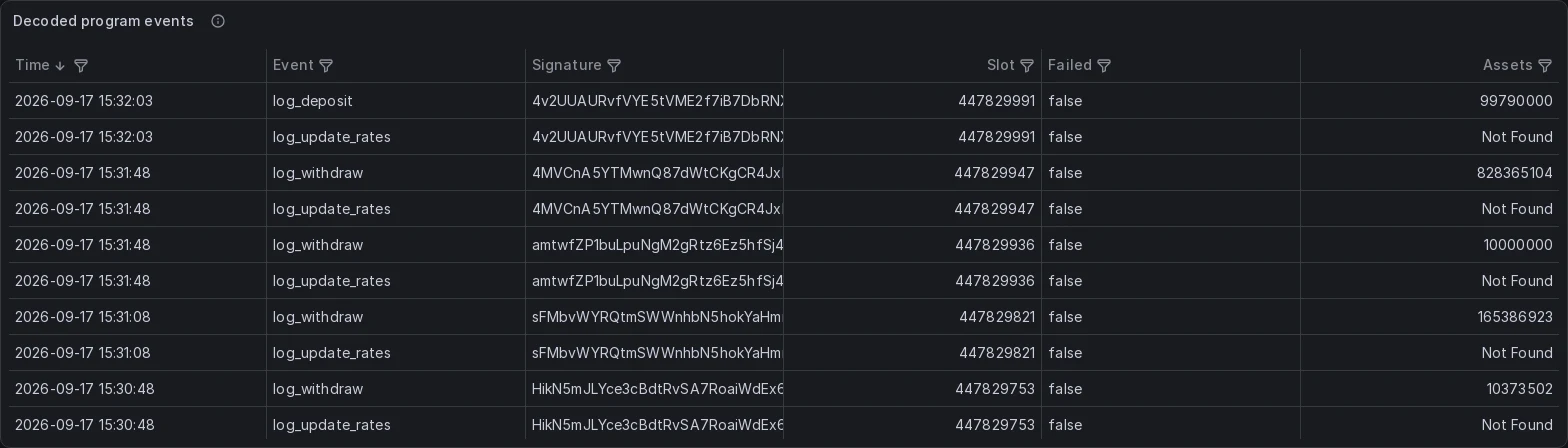
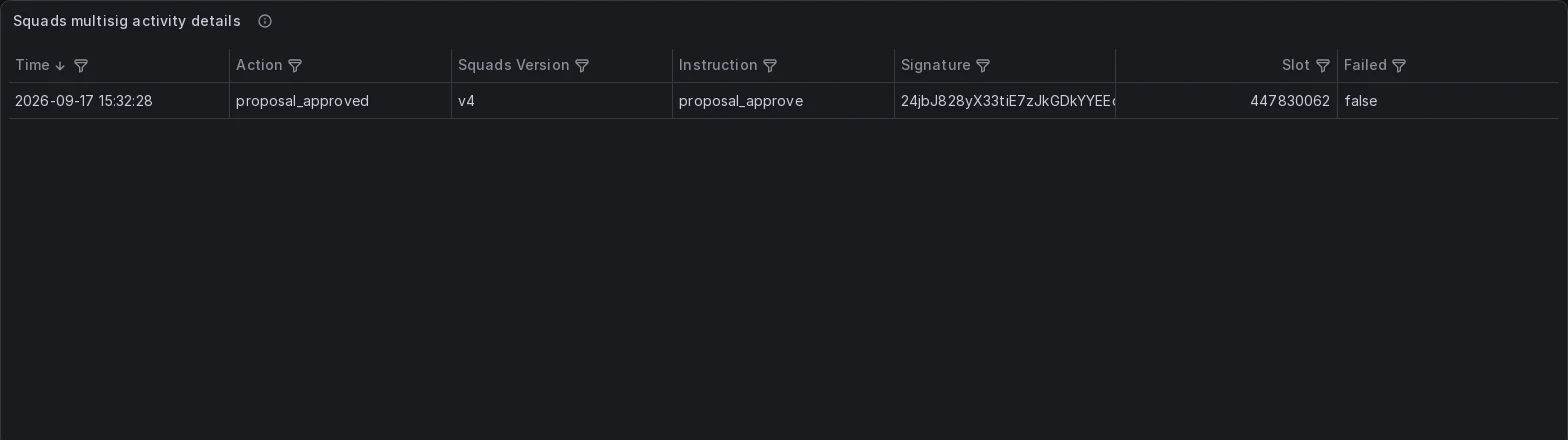

An alert carries a signal_kind label. A datasource alert reports a degraded monitoring pipeline; activity alerts identify the decoded instruction, event or multisig action. DatasourceError means Grafana could not run a rule’s query, not that your RPC endpoint is down.
Try it today
- Decoded deposits, withdrawals, redemptions and rebalances
- Critical alerts on the two instructions that change who controls the program
- A warning whenever its Squads v4 multisig creates a proposal
- Swap three values at the end to point it at your own program
A teaching example. The Solana Foundation does not operate this deployment, monitor Jupiter Lend on anyone’s behalf, or claim affiliation with or endorsement by Jupiter.
FAQ
How do I backfill history?
The indexer sees activity only from the moment it starts. With the stack running, load earlier activity from a regular RPC endpoint:
RPC_URL=https://your-rpc-endpoint just backfill 7d- It crawls your program and multisig state account with
getSignaturesForAddress, decodes through the same pipeline and backdates records to block time. - Backfilled records never trigger alerts. They fall outside the alert lookback window.
- Windows accept s, m, h, d and w and cannot exceed Loki retention: 30 days in the bundled config.
- Any failure aborts before anything is written. Prometheus metrics are not backfilled.
On Grafana Cloud, push through Alloy and state the depth cap yourself: add --loki-url http://alloy:3100 --loki-max-age 30d.
What does it cost to run?
About $50 a month on AWS or GCP for the VM, disk and public IPv4 address, or run it on your own machine. Buckets and secrets cost cents. You pay for your own Yellowstone or RPC endpoint.
The stack needs 2 vCPUs, 4 GiB RAM and 40 GiB disk. The first-boot Rust build sets that floor; steady state uses less.
Can I watch more than one program?
Yes, with one Microscope deployment per program. Each deployment watches one program and optionally one Squads multisig because its decoder is built from that program’s IDL. The Terraform modules can run several deployments from the same directory.
Do I need a Squads multisig?
No. Leave out the [multisig] block and Microscope monitors the program only.
An alert fired. How do I investigate?
Every alert carries a signal_kind label. datasource means the pipeline is degraded or lost data. instruction, event and multisig mean your program did something you asked to hear about.
The repo’s diagnose-incident agent skill classifies the alert, checks upstream alerts, confirms the cause against live metrics and logs, assesses data loss, suggests a runbook fix and writes an incident report.
Investigation is read-only. Any deployment change waits for your confirmation, and the skill never reads values out of .env.
My dashboard is empty. Is my program quiet, or is Microscope broken?
Every deployment gets health alerts for its own pipeline whether you configure them or not. They cover a stalled stream, stale or failing RPC polls, a corrupt checkpoint and log delivery.
Check those alerts and the Indexer up panel before concluding the program is quiet. The diagnose-incident skill does this check for you.
Does it work on devnet?
Yes. Point your endpoint at devnet and add ?cluster=devnet to explorer_transaction_url so alert links open the right cluster.
Can I add another alert channel?
Slack, Telegram and PagerDuty are supported today. Microscope is open source, so you can build another channel and contribute upstream. See CONTRIBUTING.md.
Resources
Microscope
Built on
The pinned IDLs behind multisig decoding.


